Business models and stakeholder presentation diagrams
Problem:
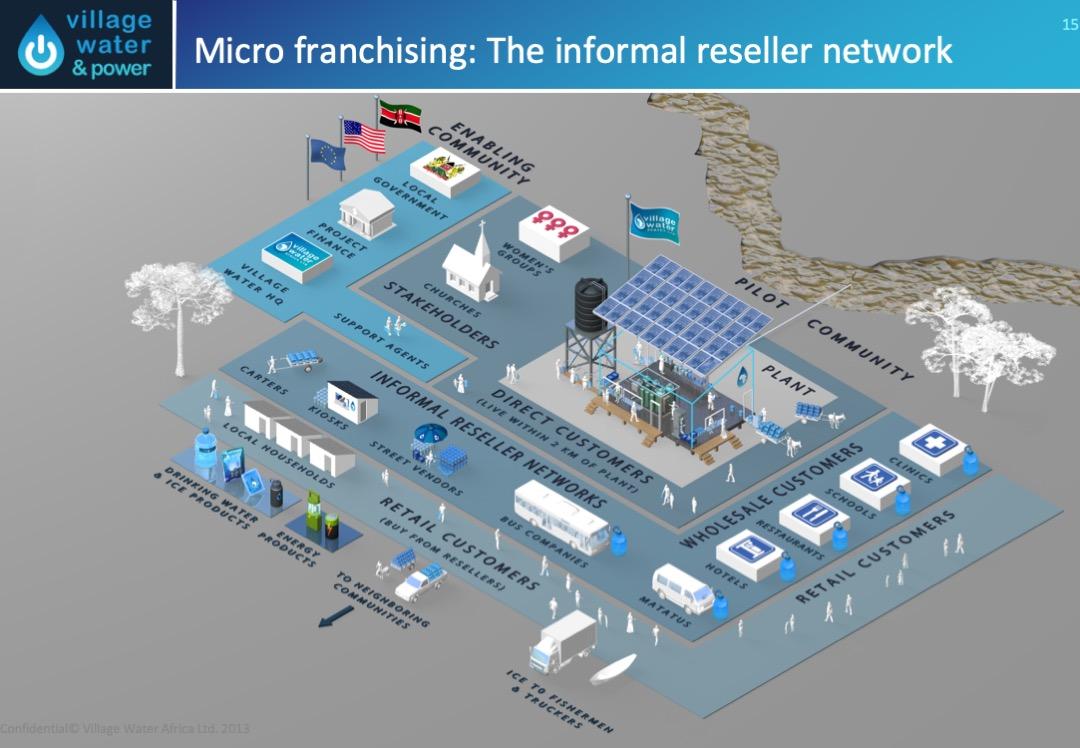
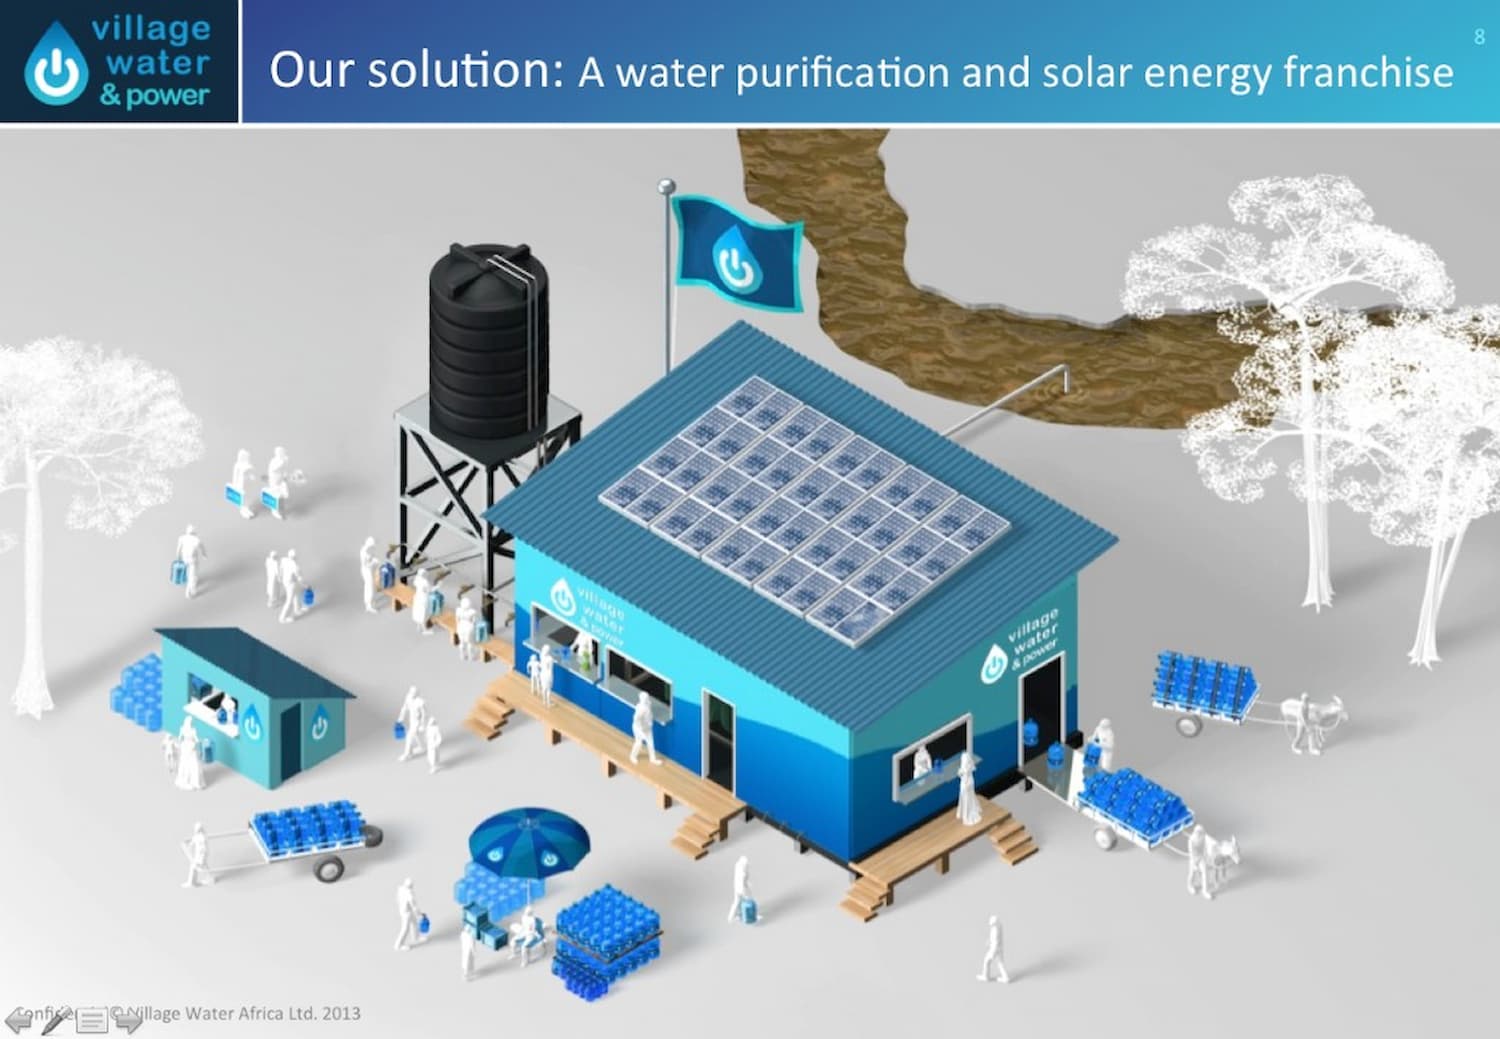
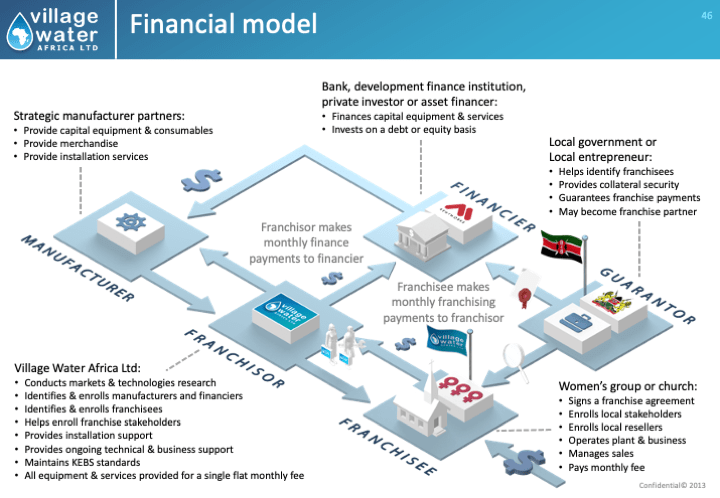
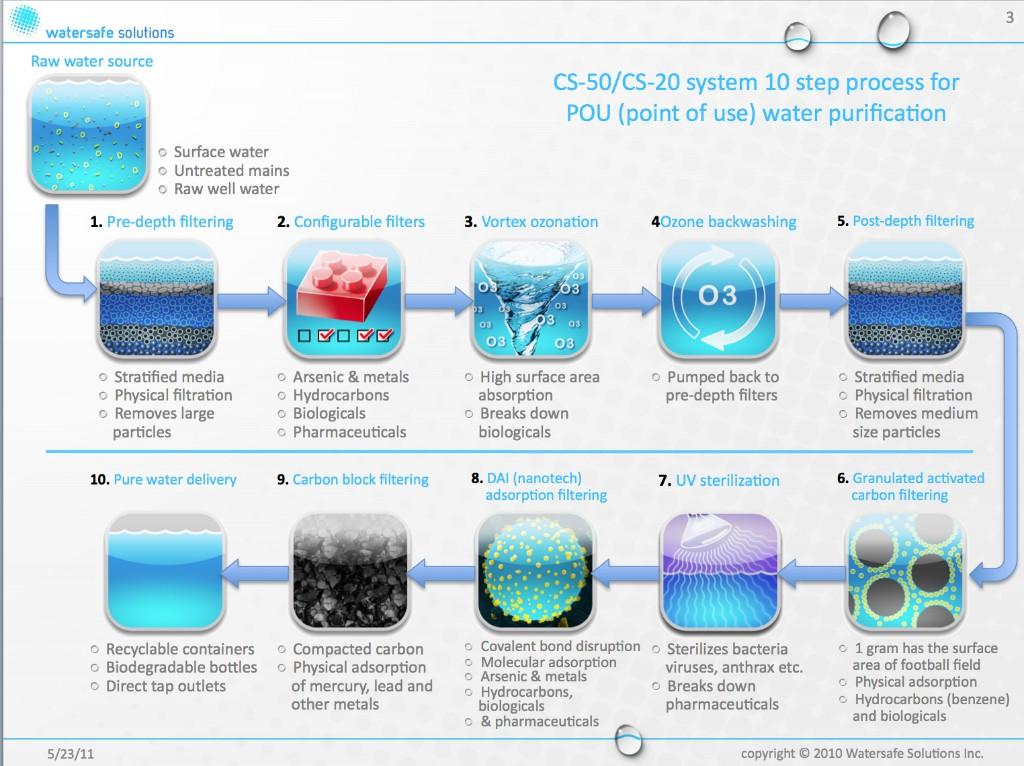
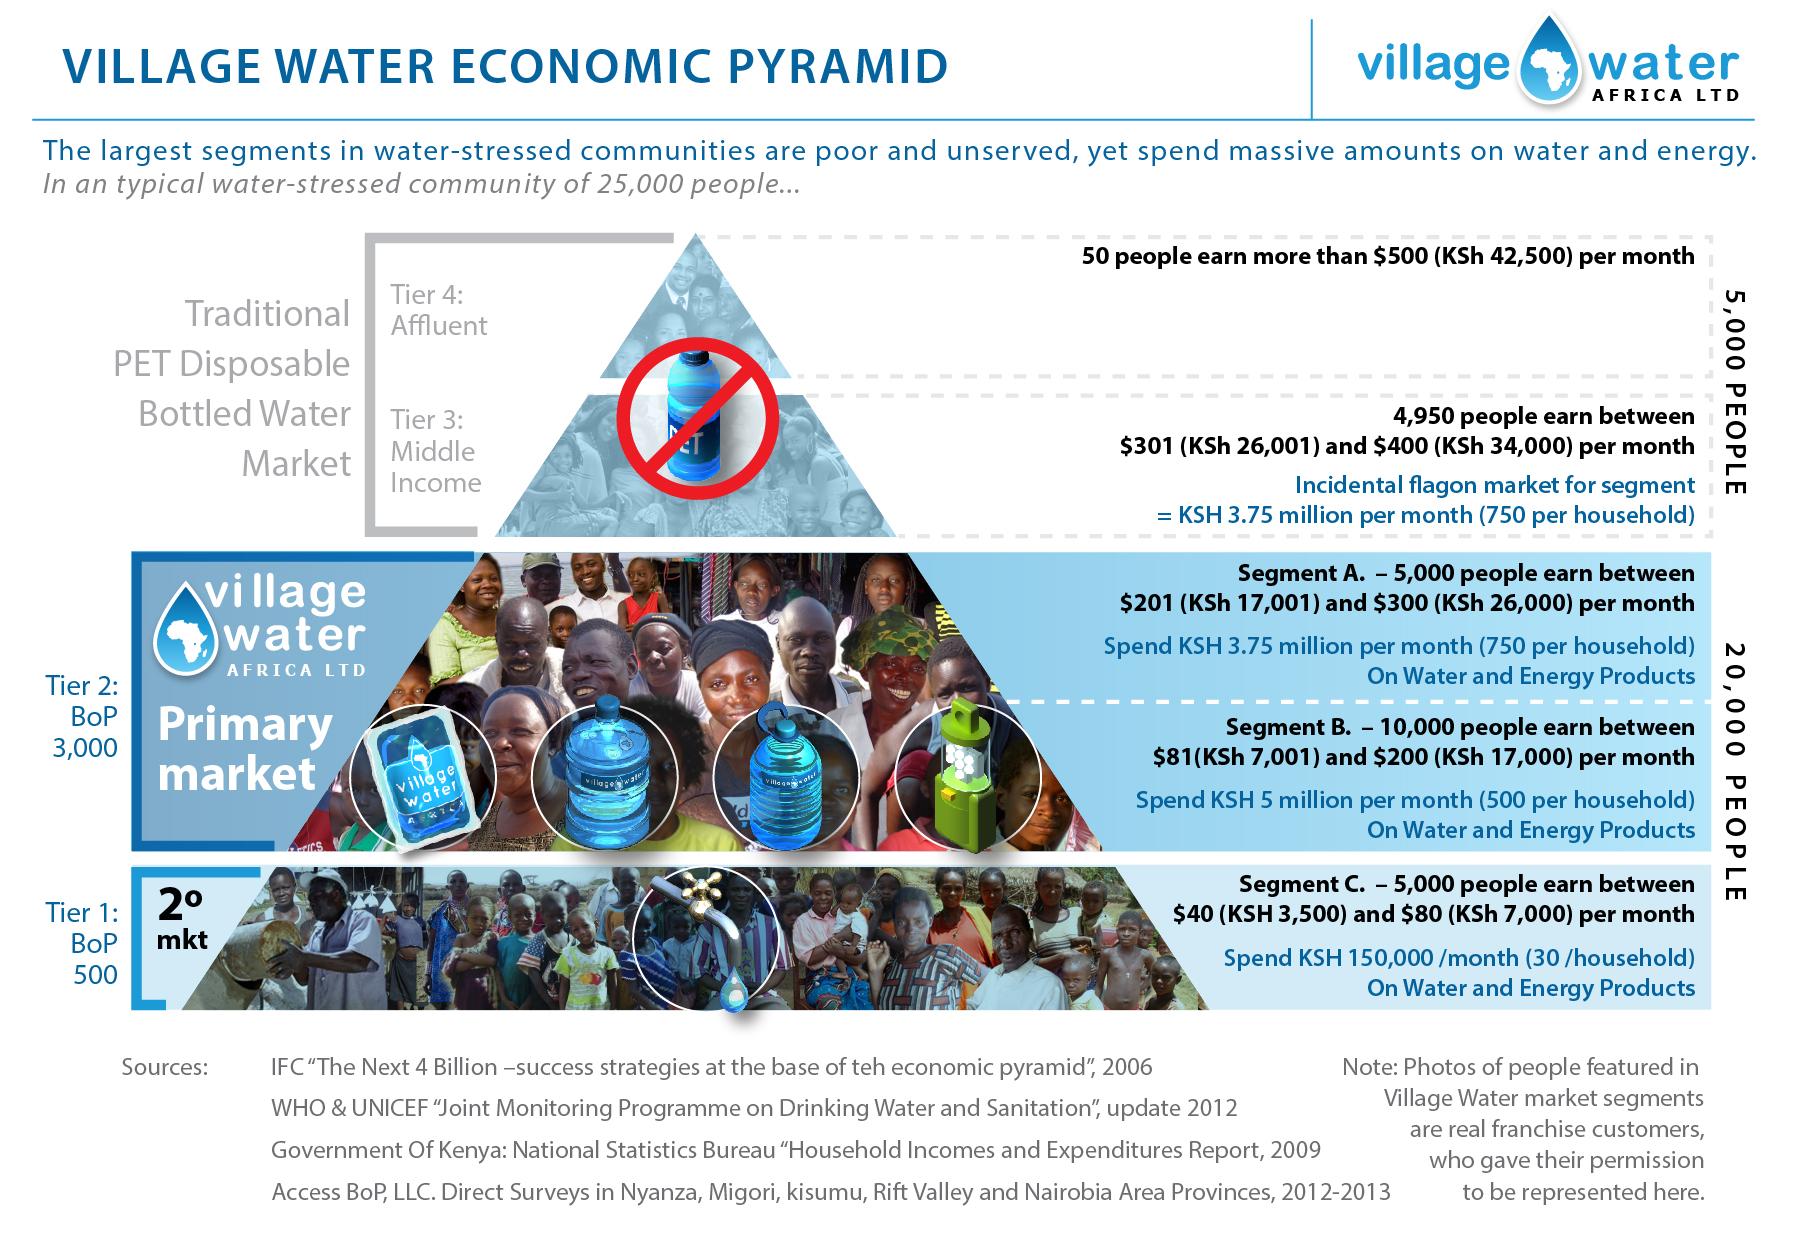
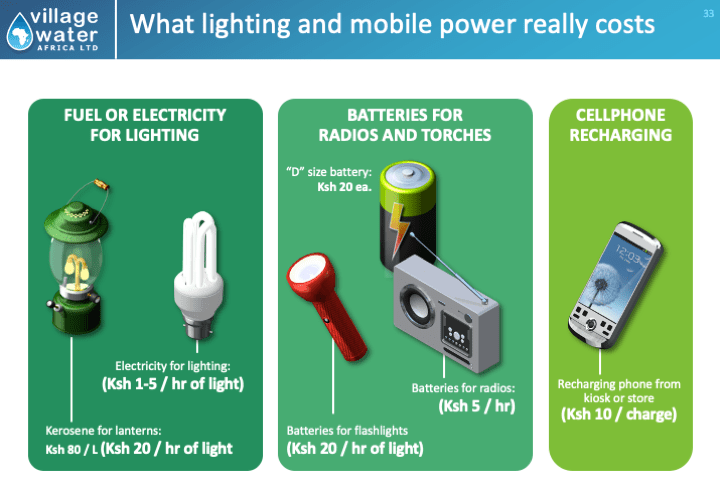
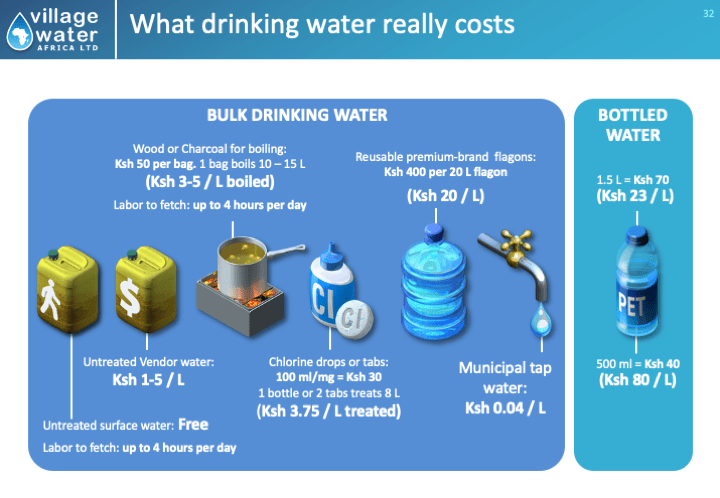
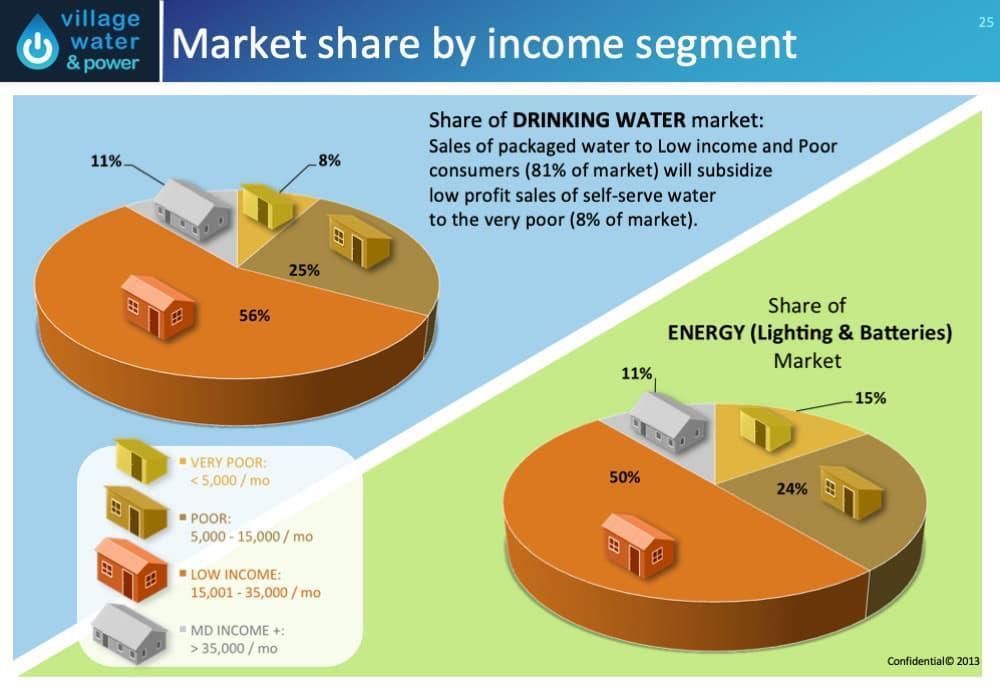
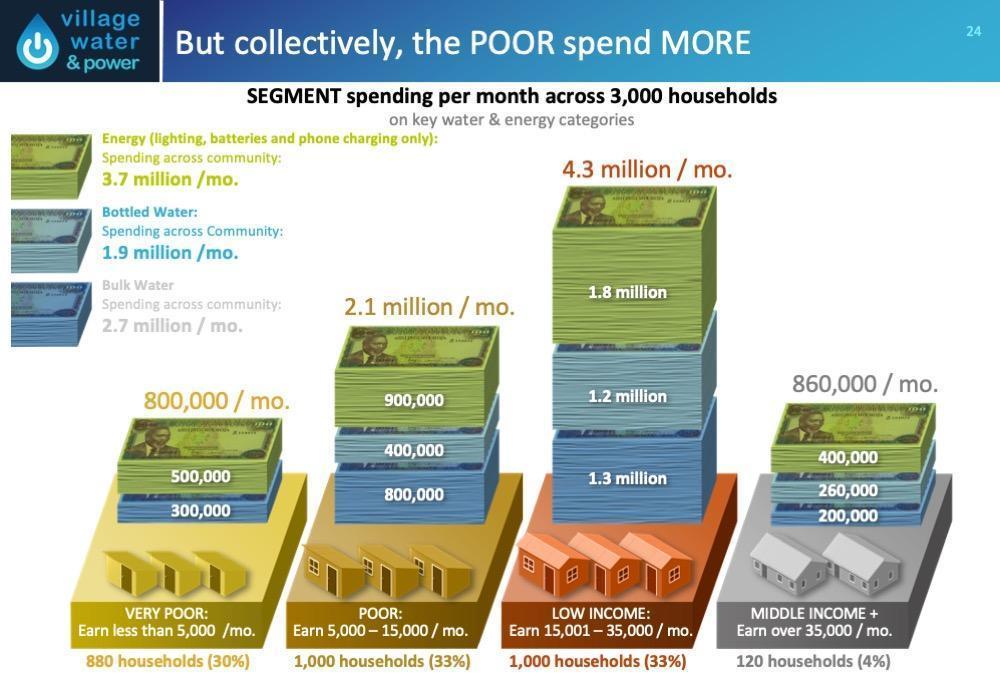
Village Water was a unique social enterprise, founded in Kenya to bring safe, affordable drinking water and cheap renewable energy to water-stressed communities across East Africa. The business model used the UNDP’s Growing Inclusive Markets framework and presented informal reseller networks with transformative income opportunities. Various diagrams were produced to visualize the informal reseller network, the base of the economic pyramid, the water purification process, the financial model, and spending across poorer segments on water and energy.
Click on the carousel arrows to view the next diagram
Previous
Next
Genesis-DC
Business models and stakeholder presentation diagrams
Problem:
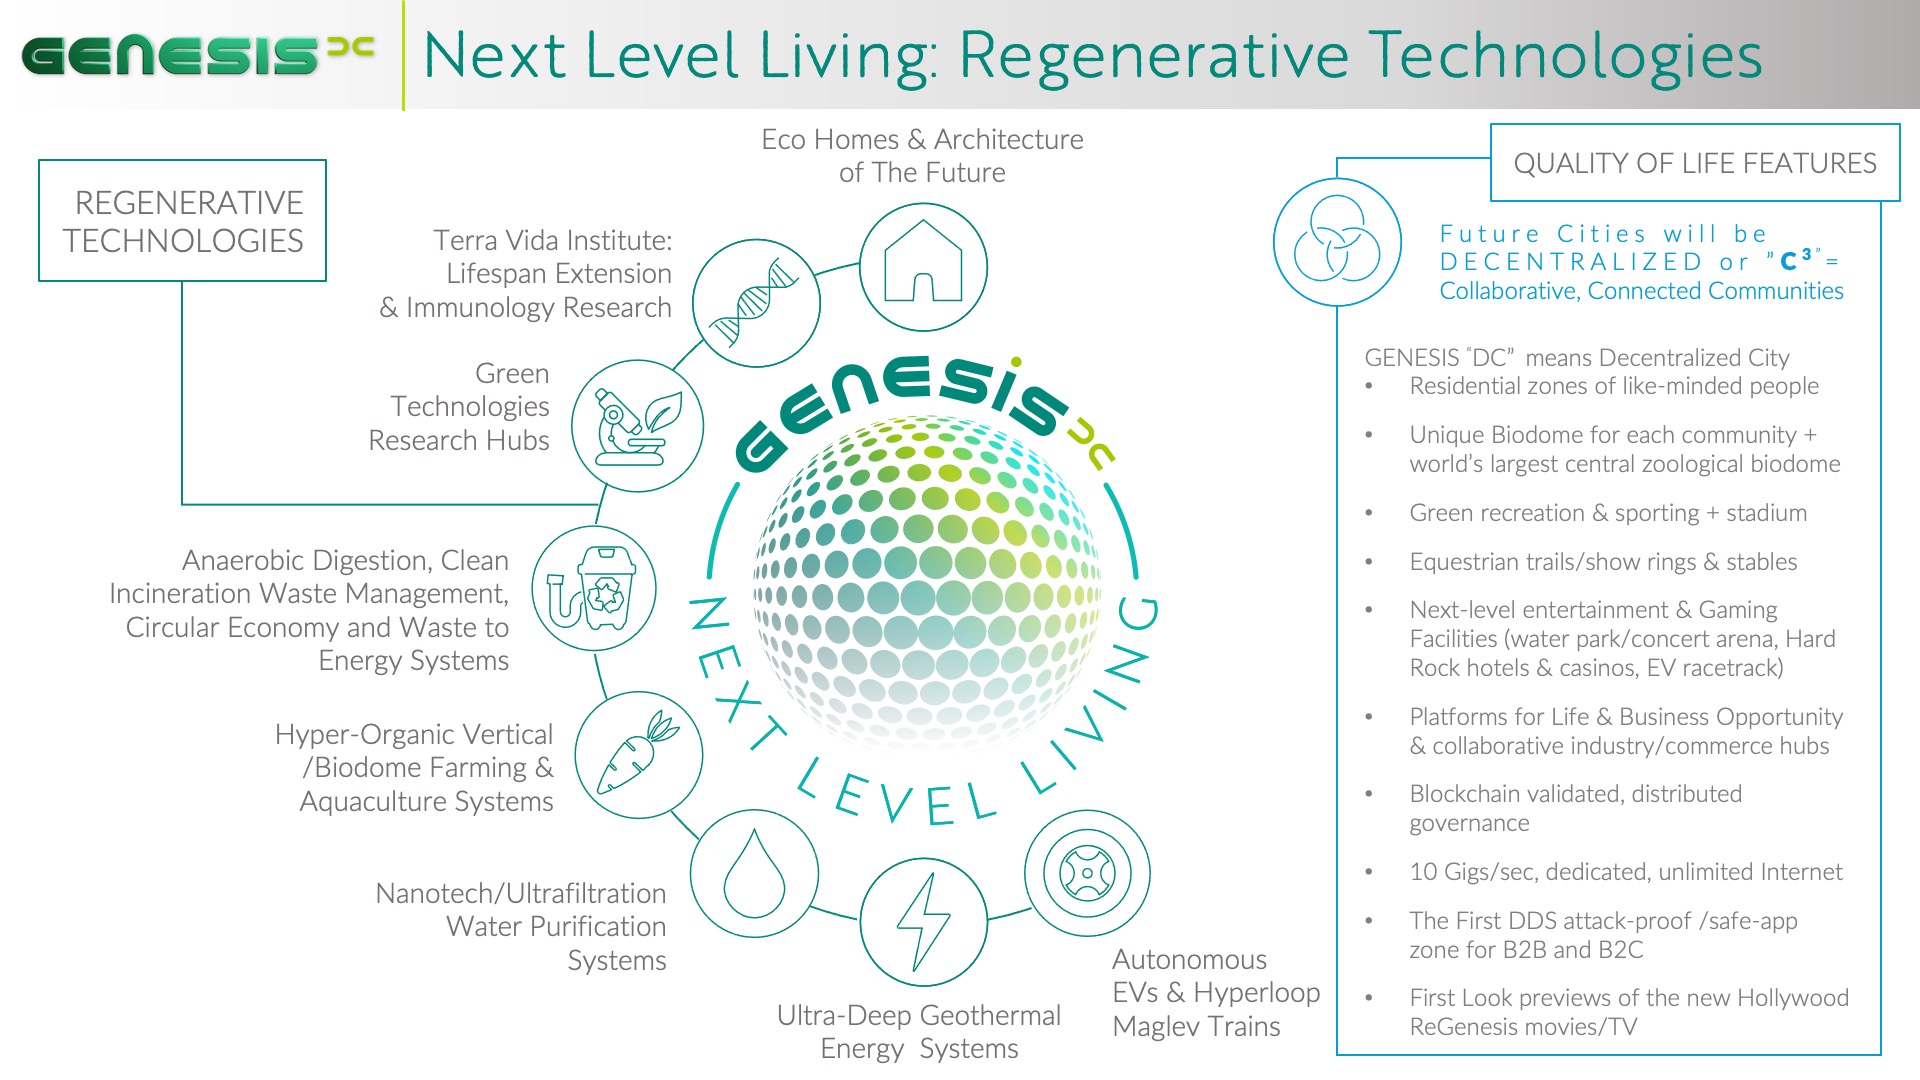
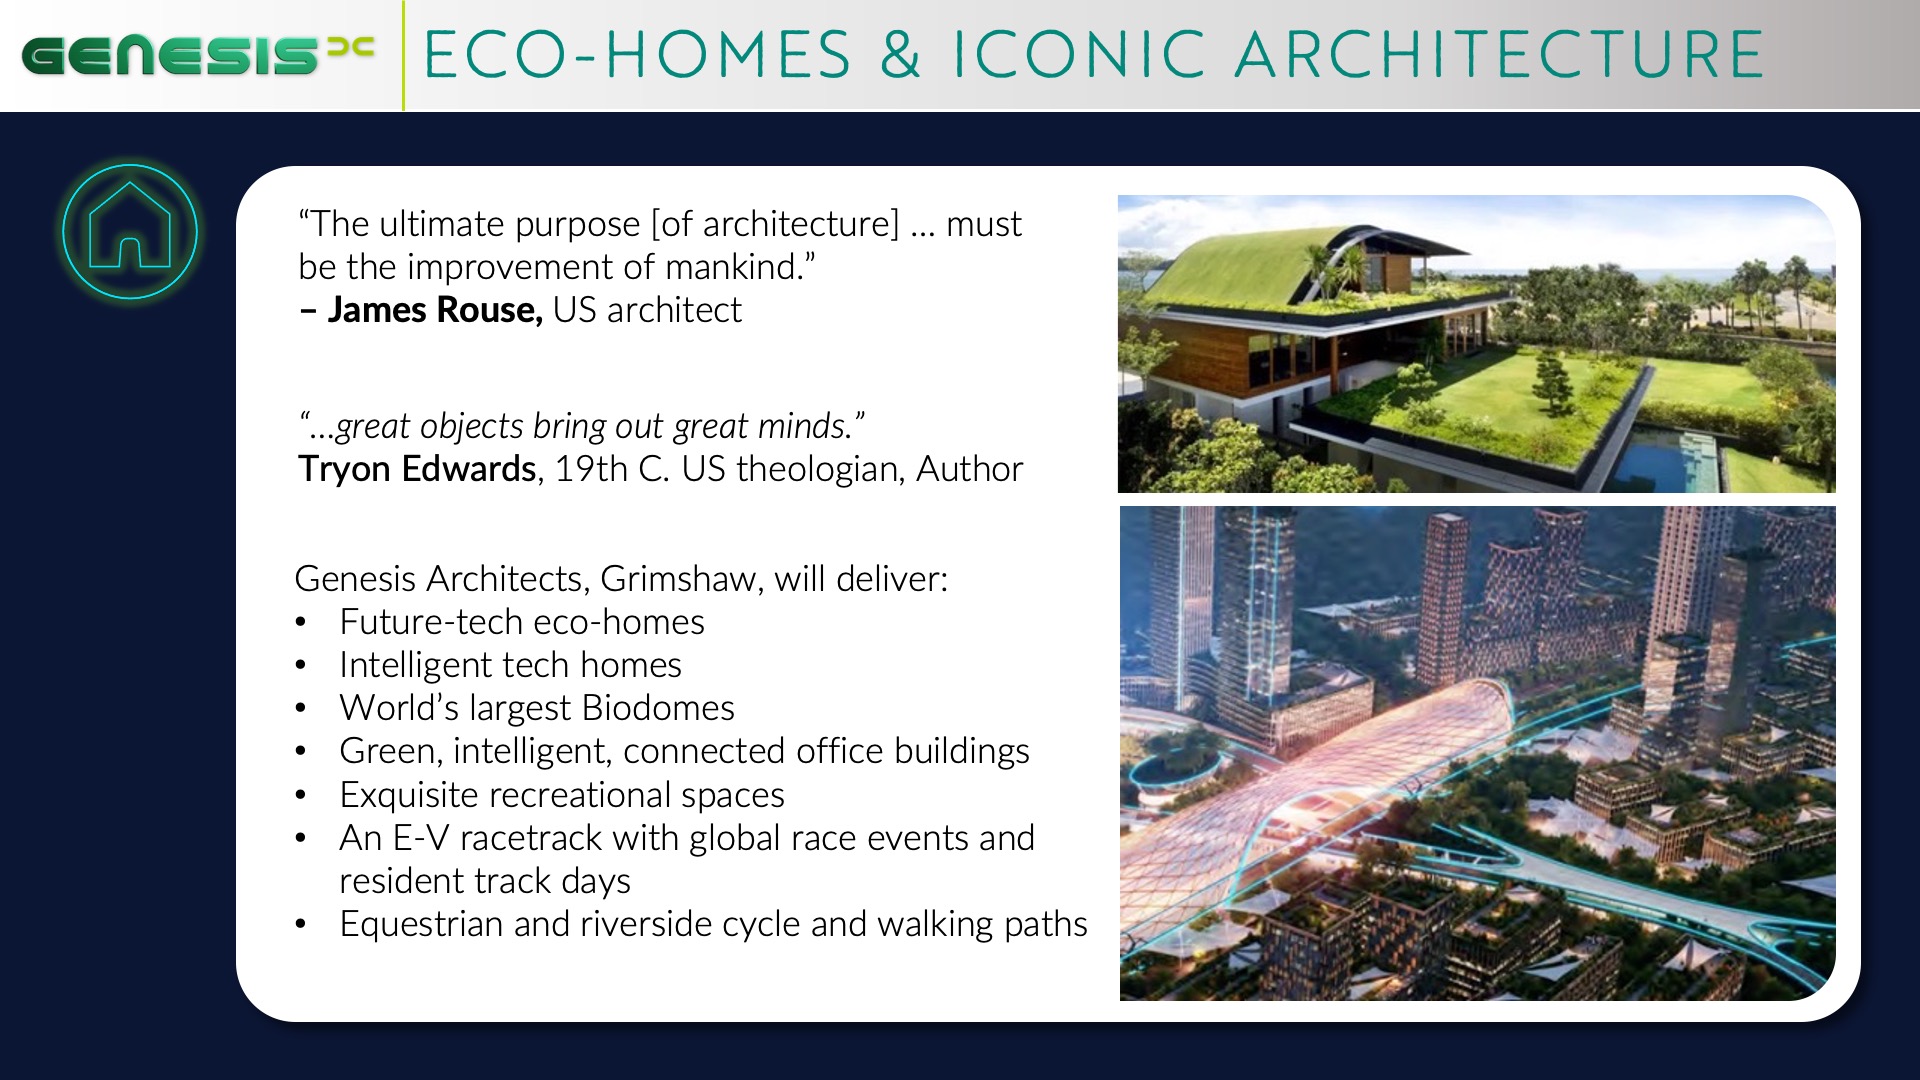
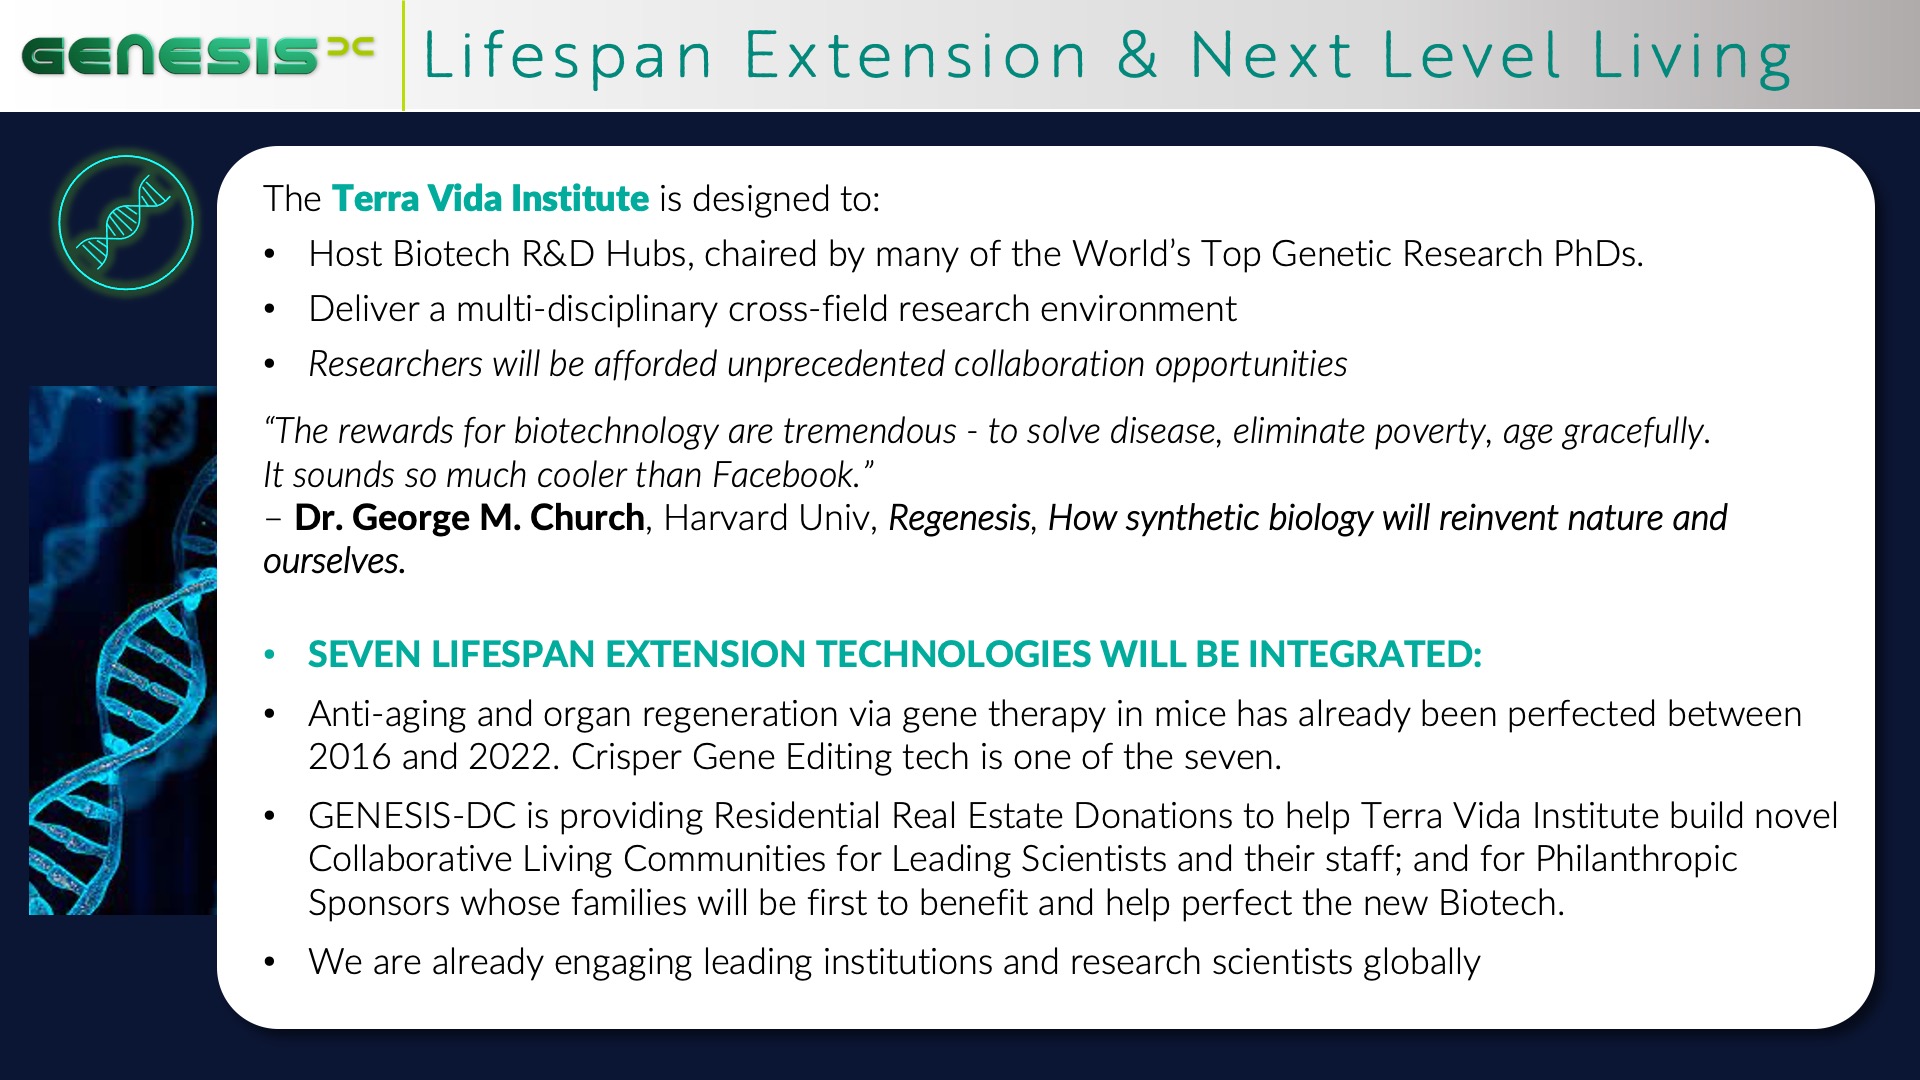
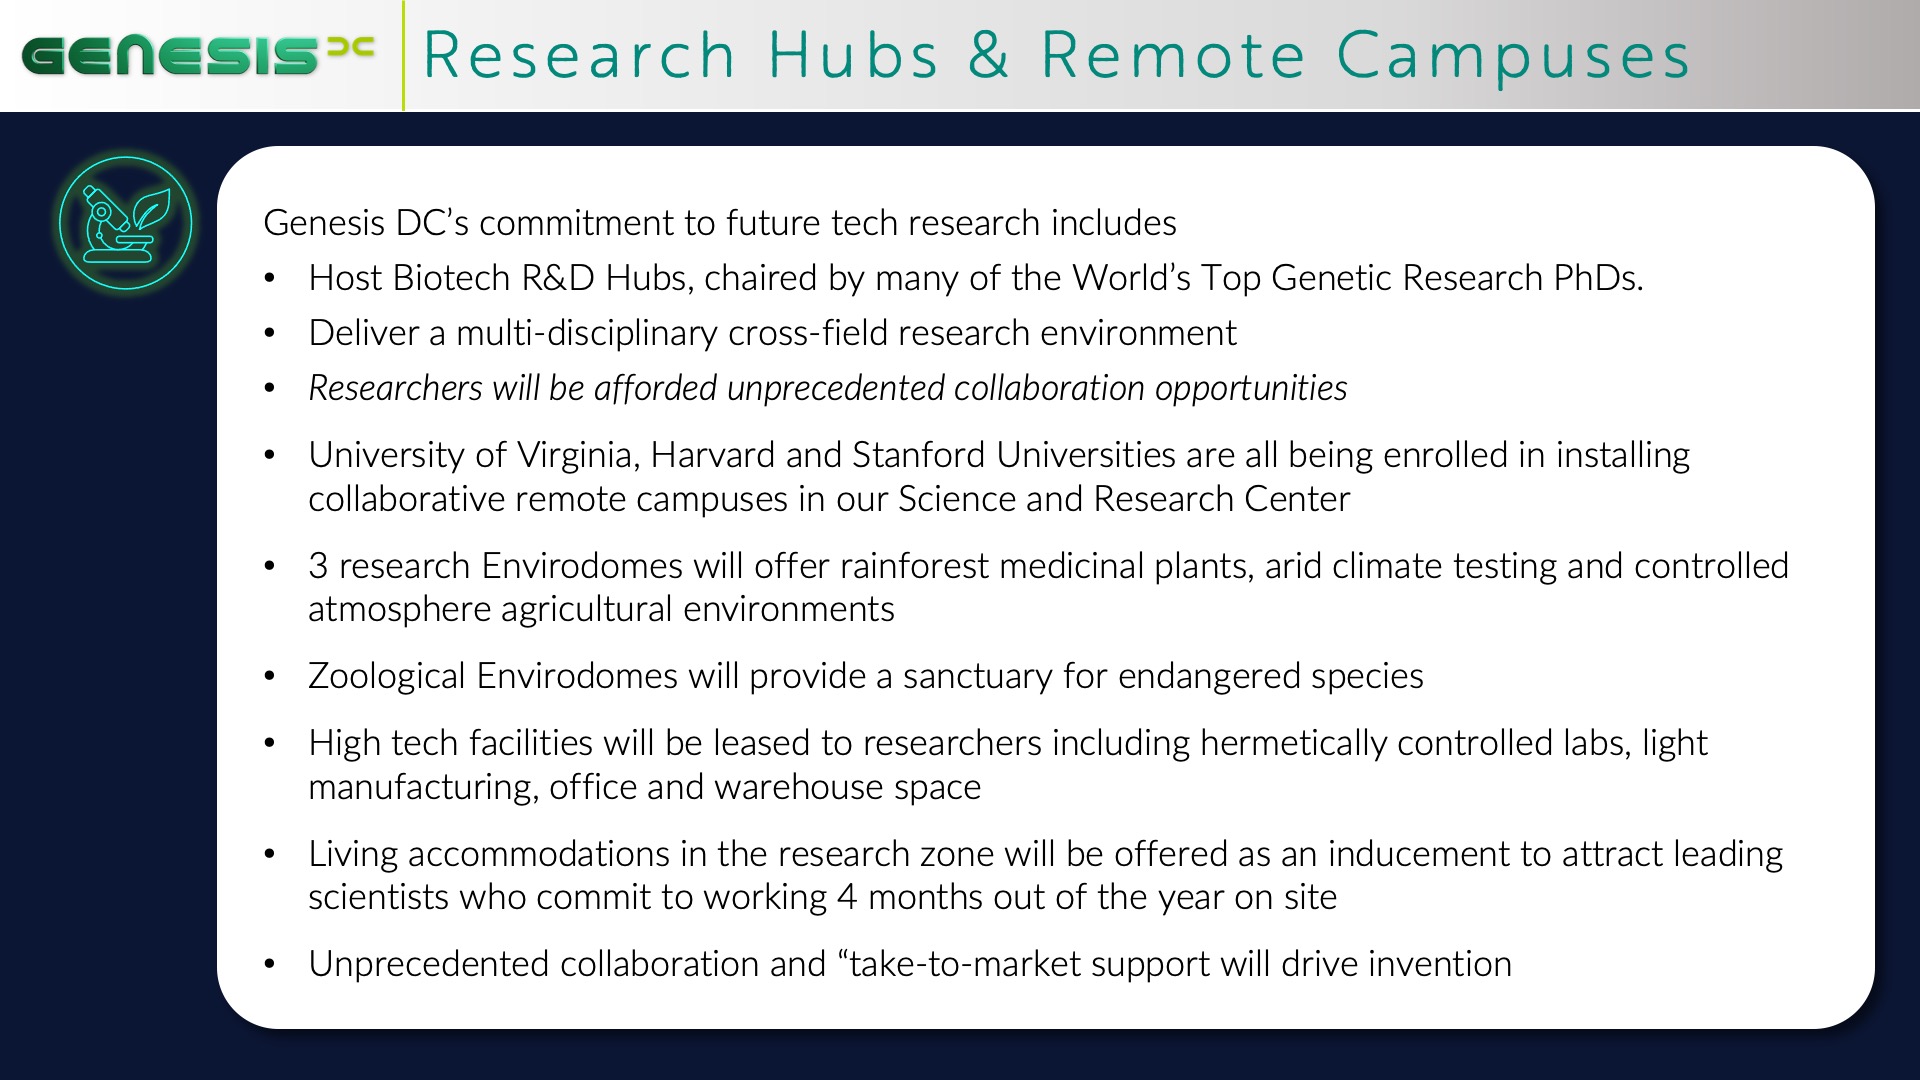
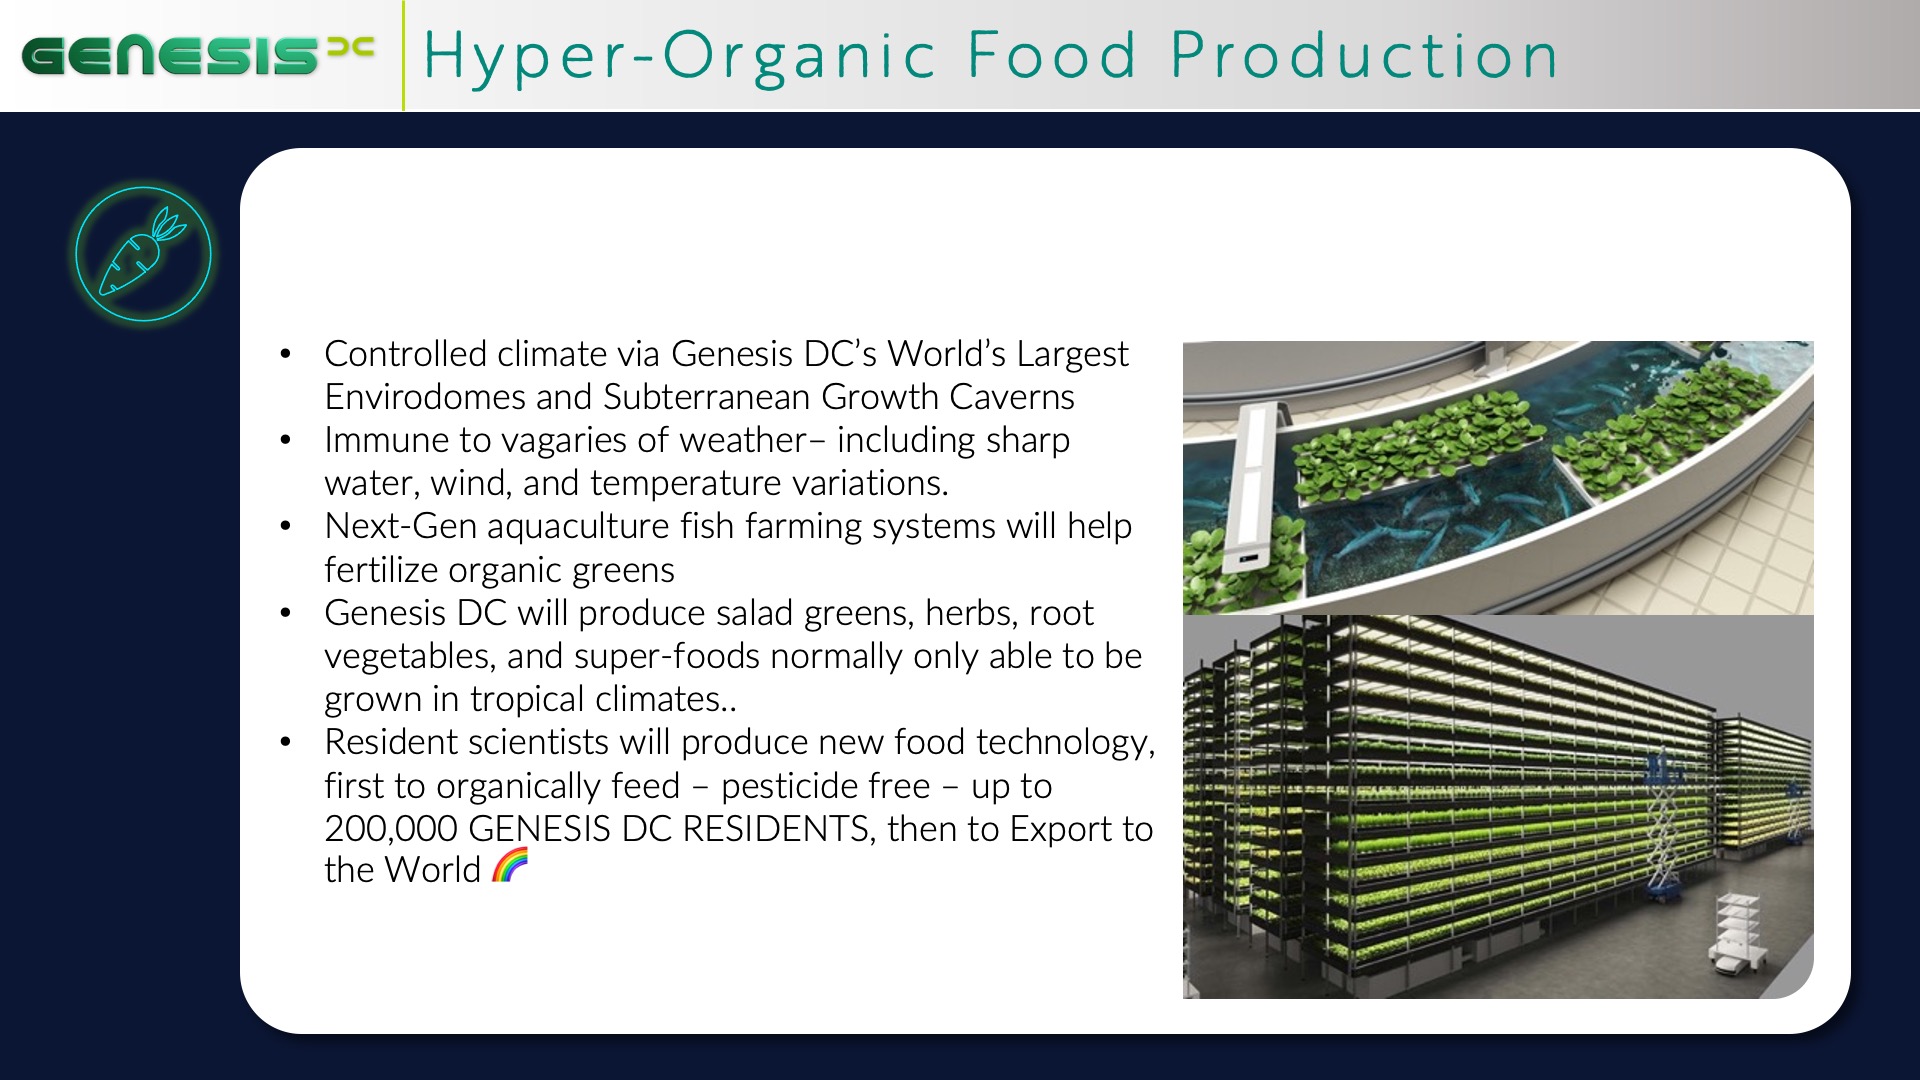
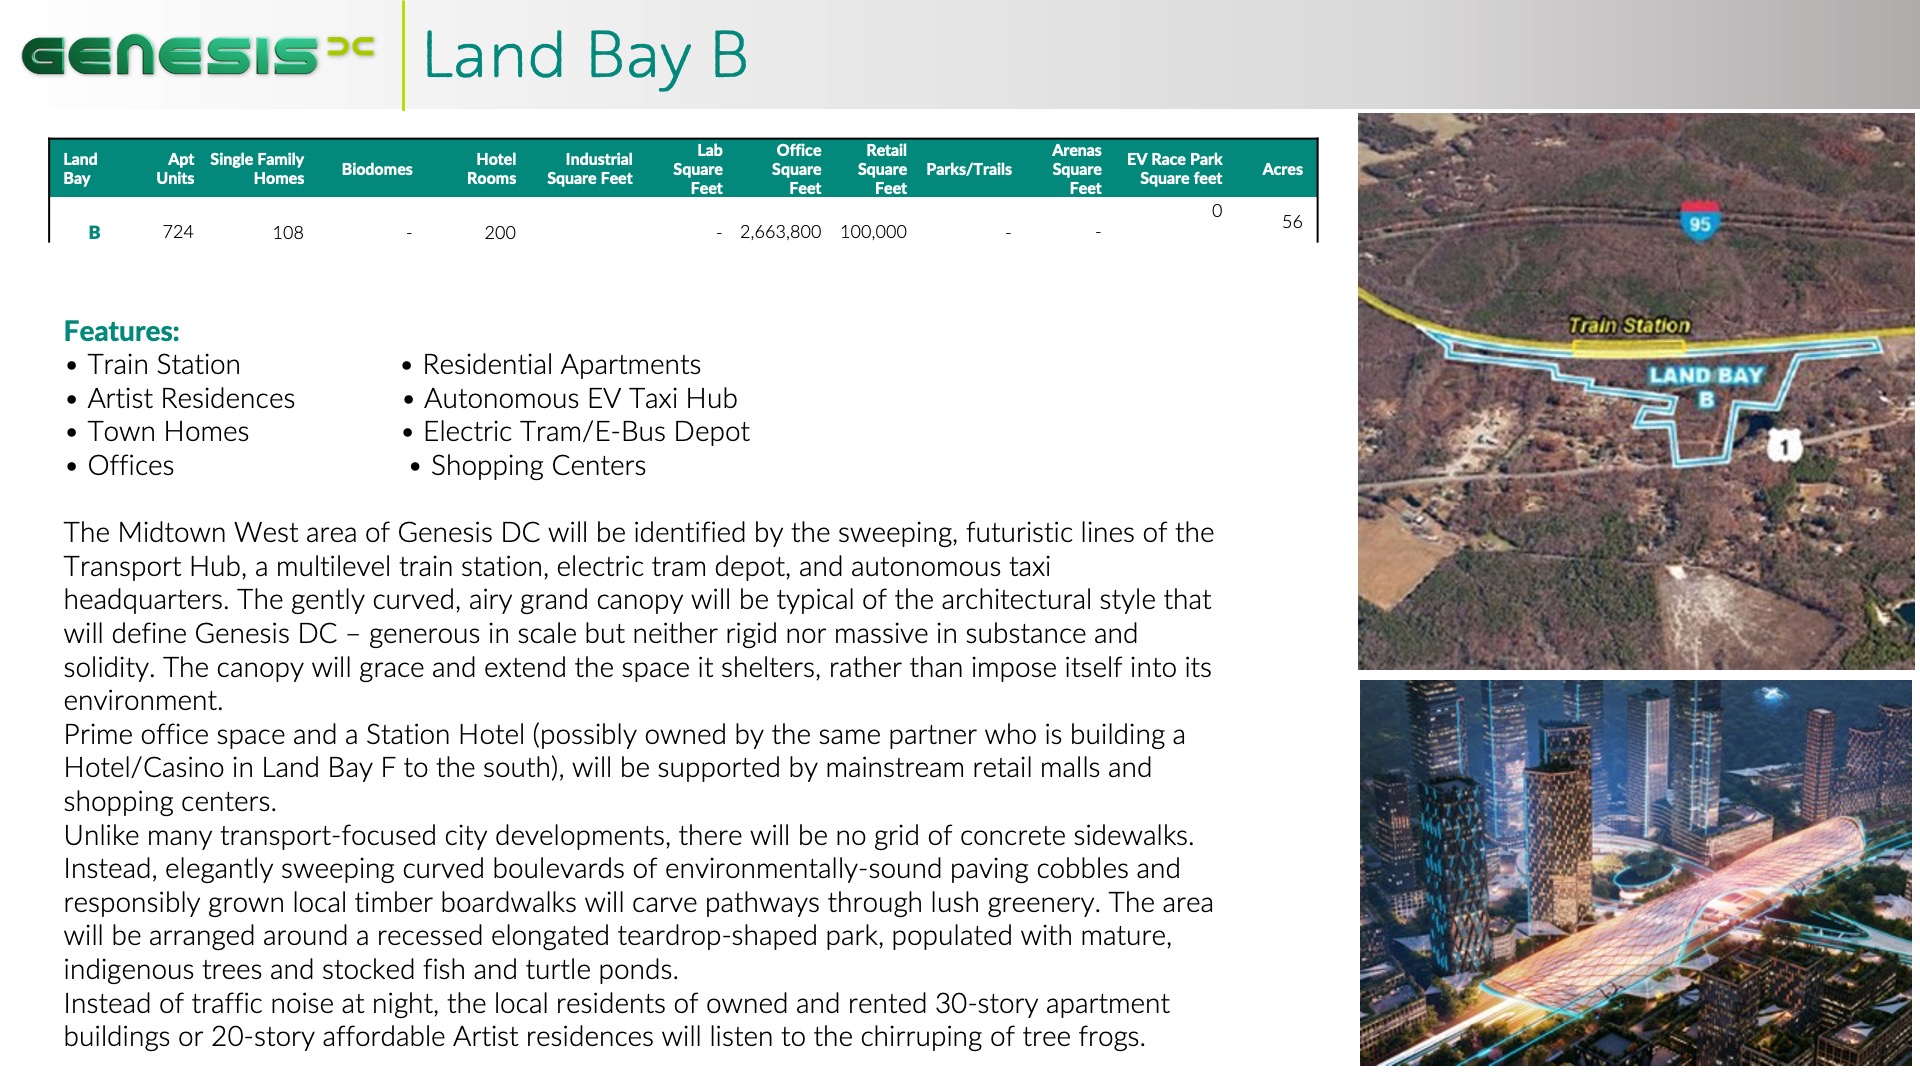
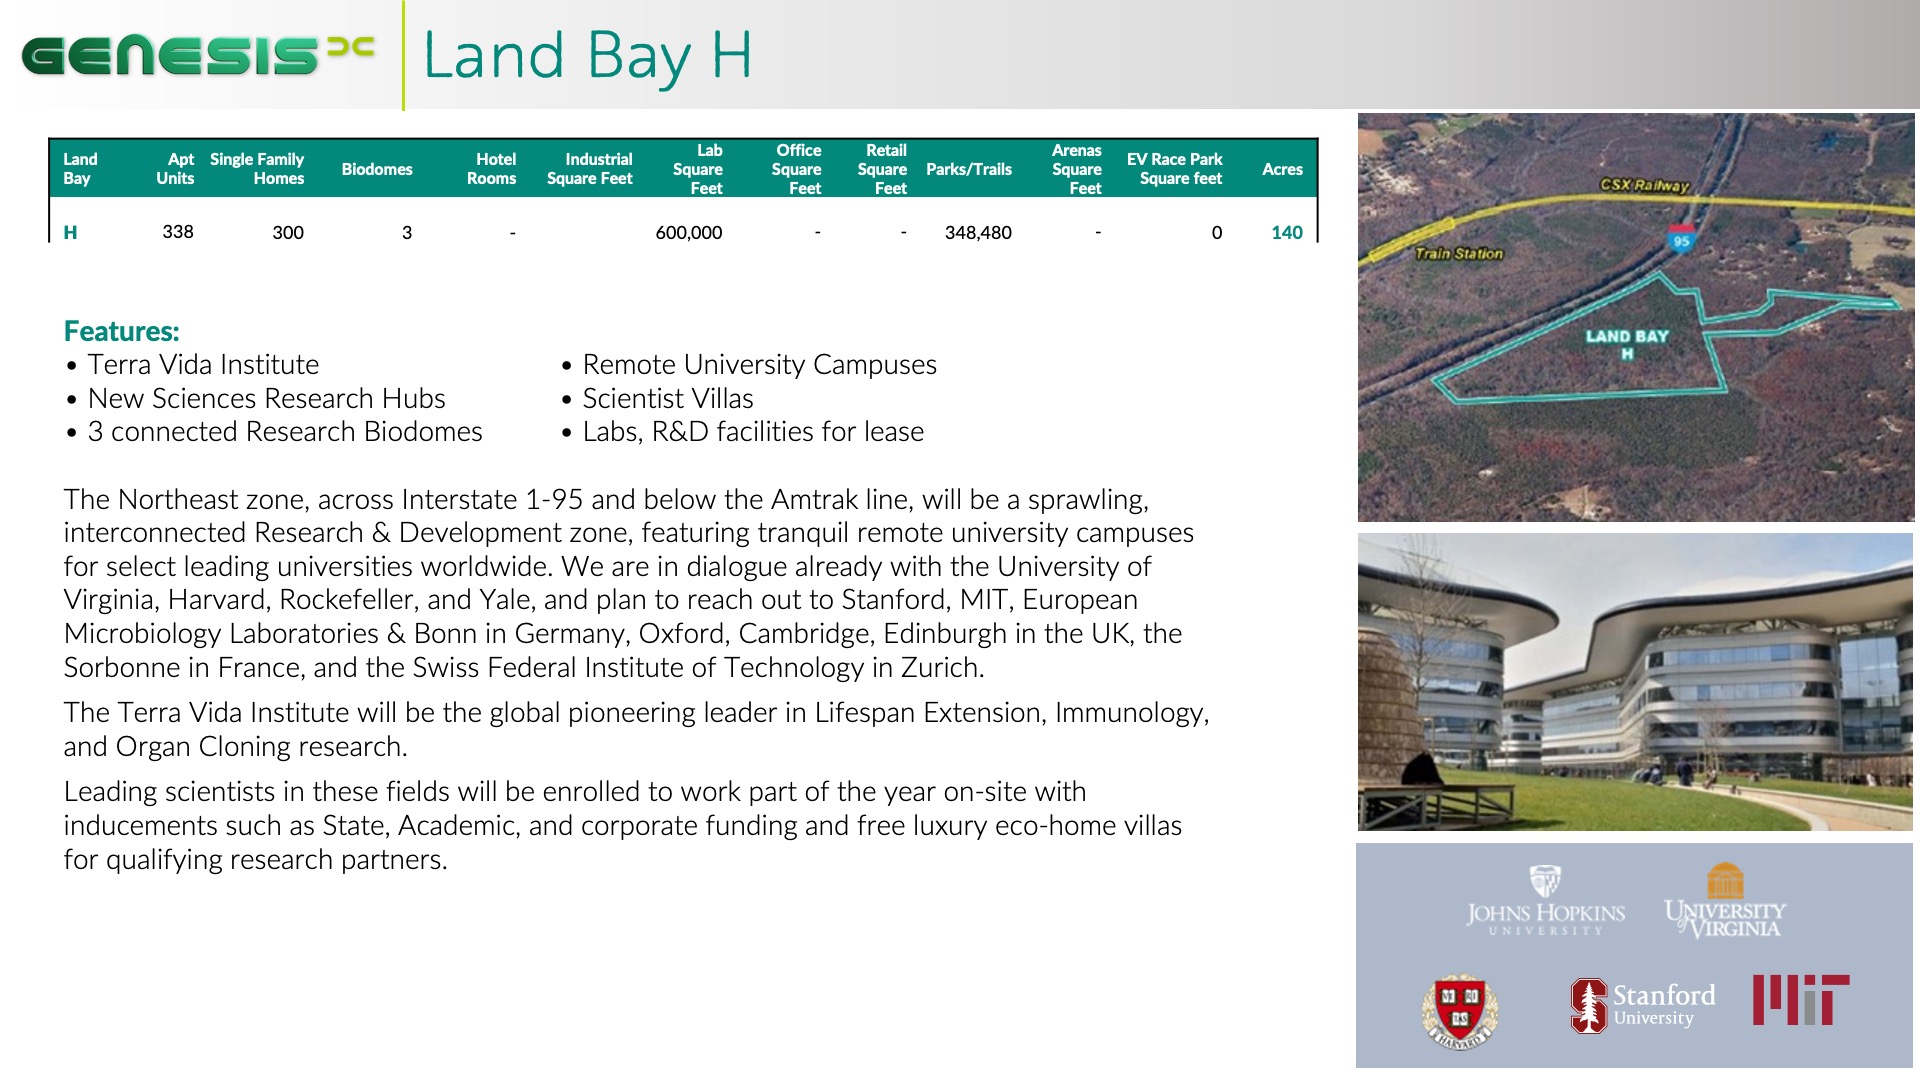
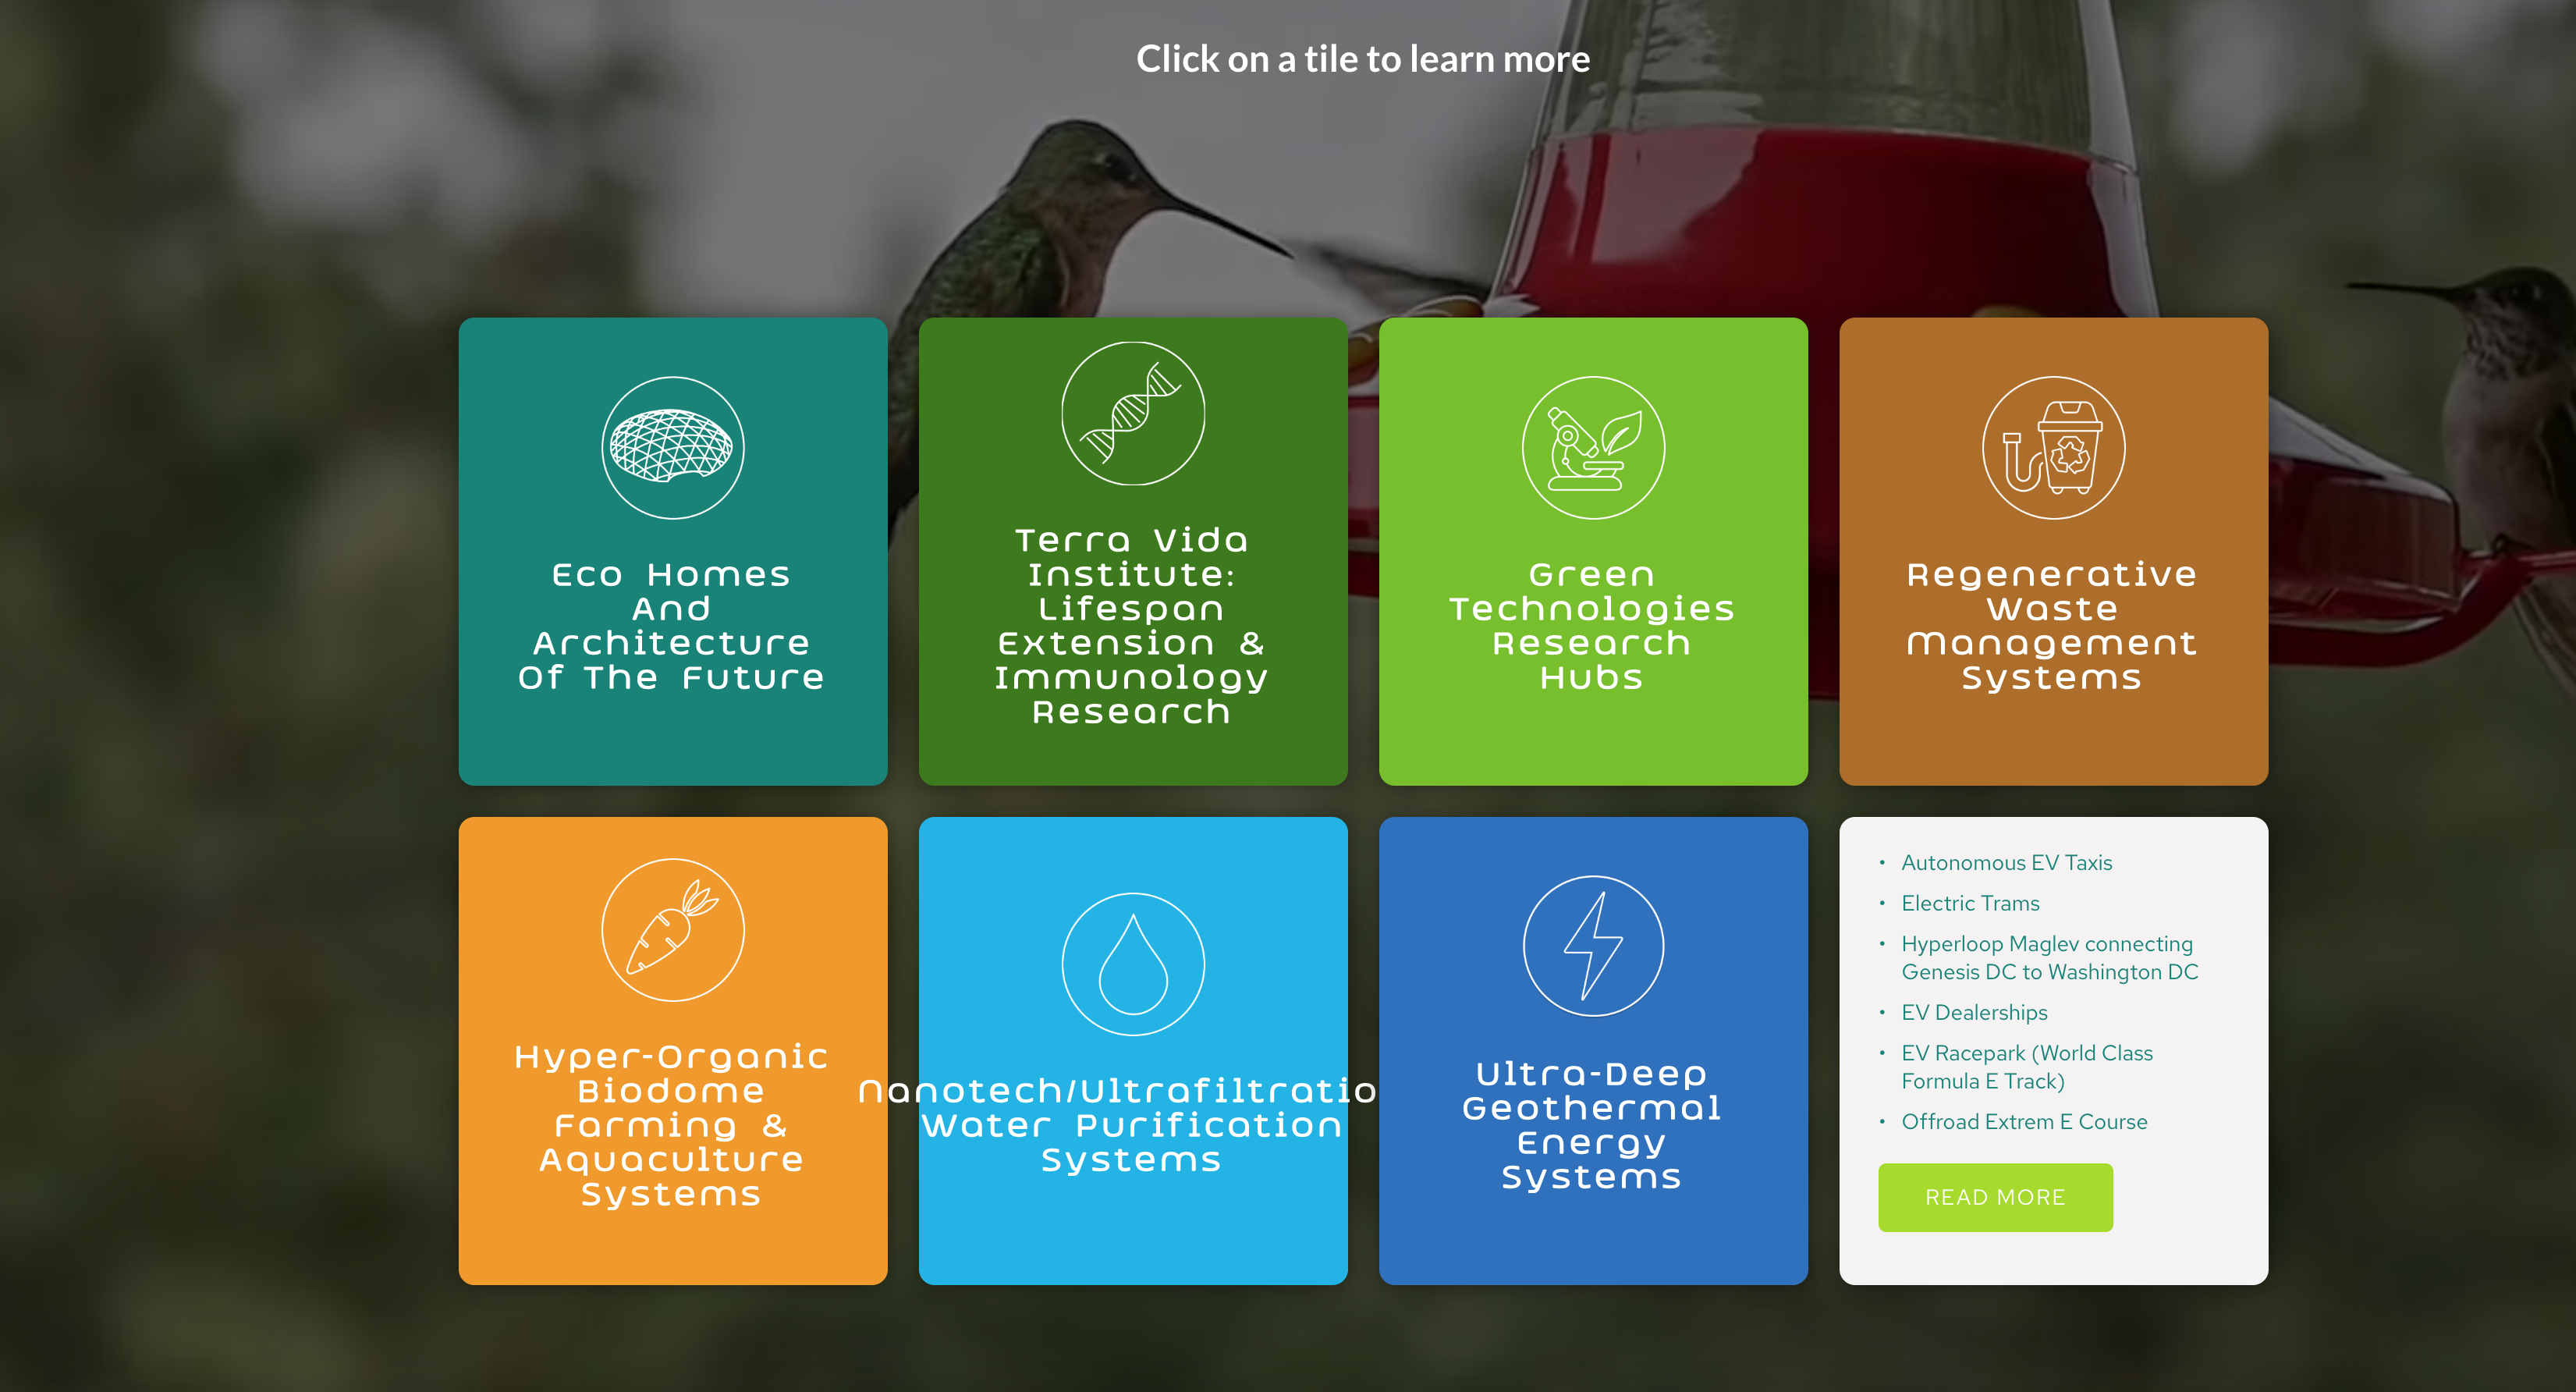
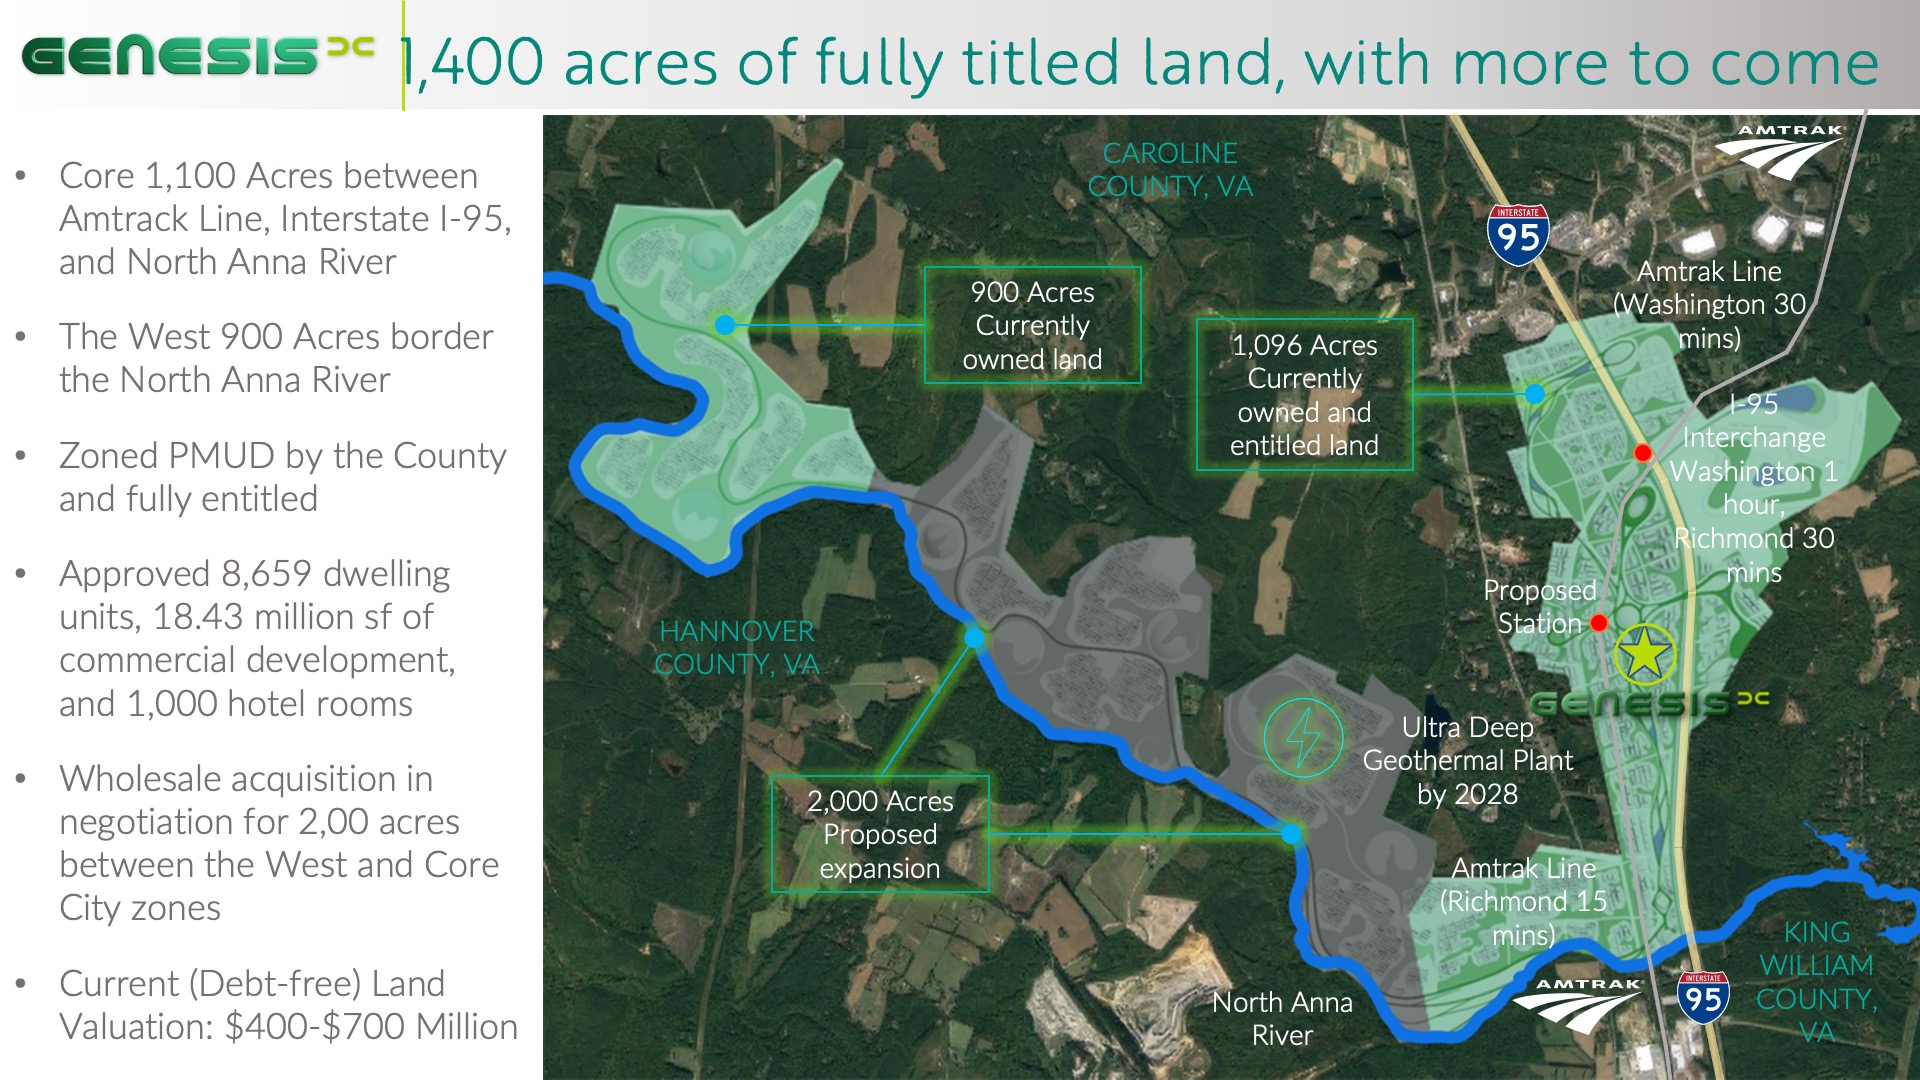
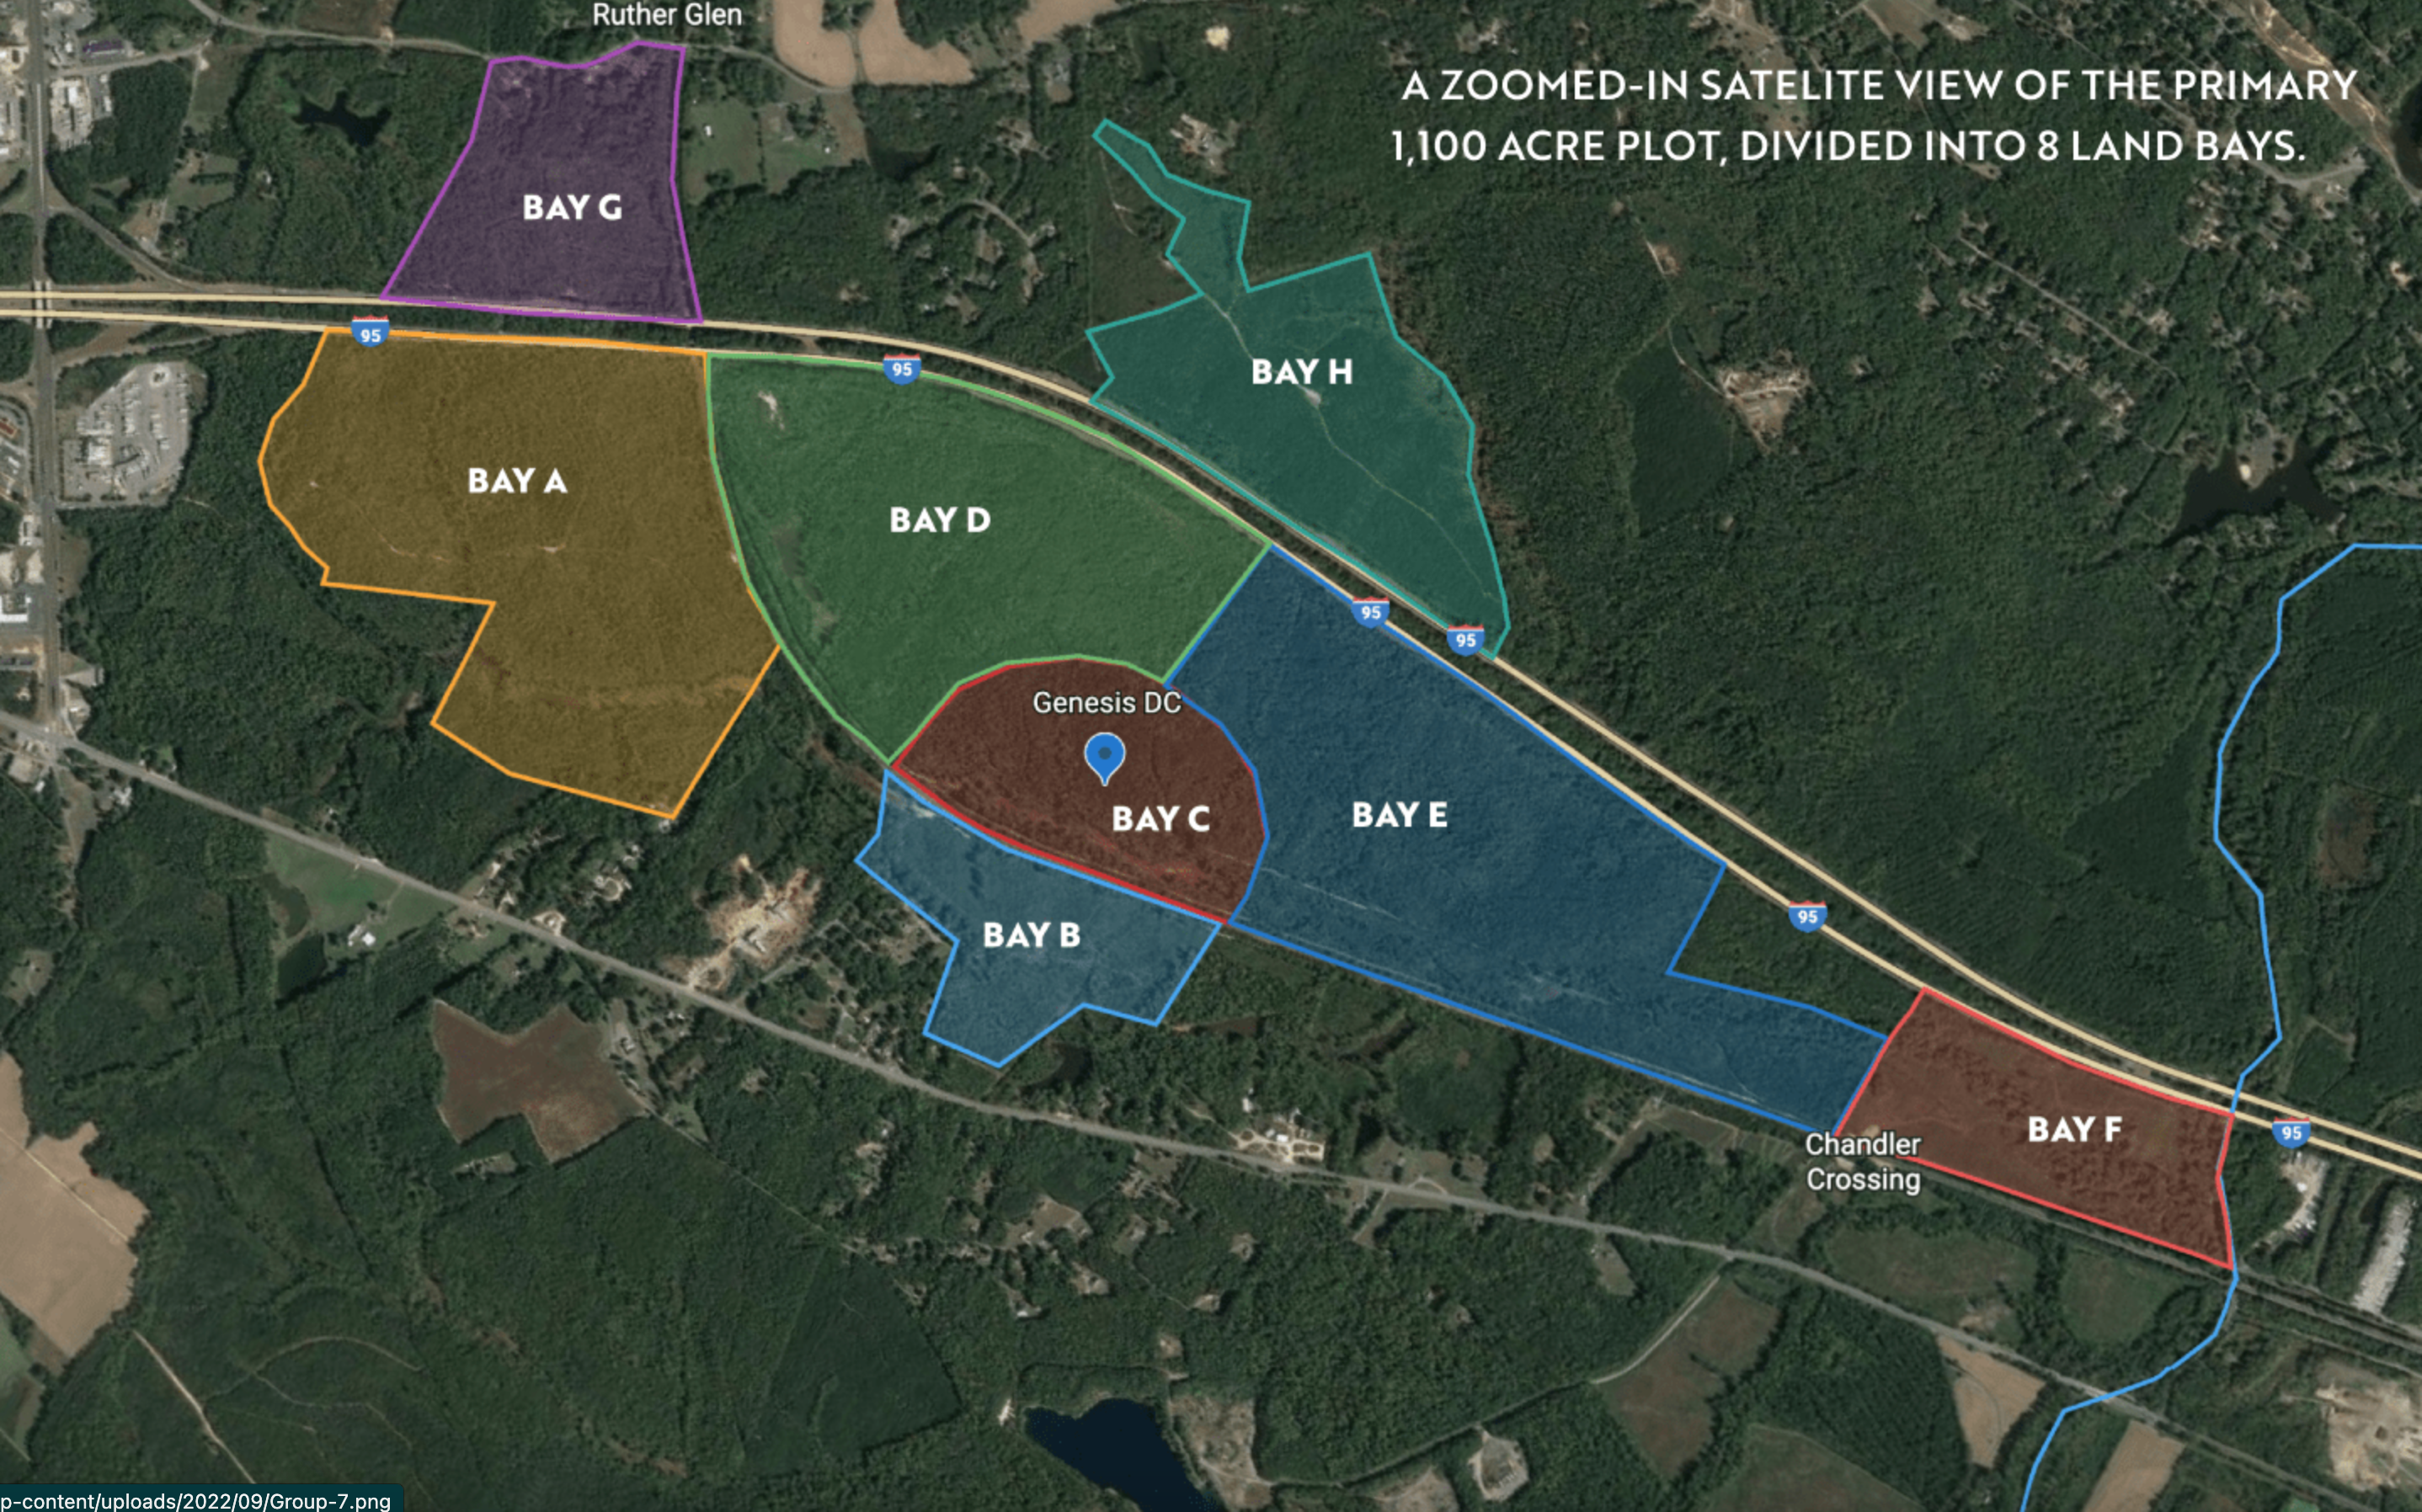
Genesis-DC is a planned, purpose-built smart city that will be built using eight regenerative (beyond sustainable) technologies. In the investor pitch deck, the problem was how to represent these technologies in a way that implied synergies between them and a global effect, while identifying each with an easily understood and compelling icon. Furthermore, we needed a way to display extended information on each technology topic, within the limited format of a PowerPoint slideshow.
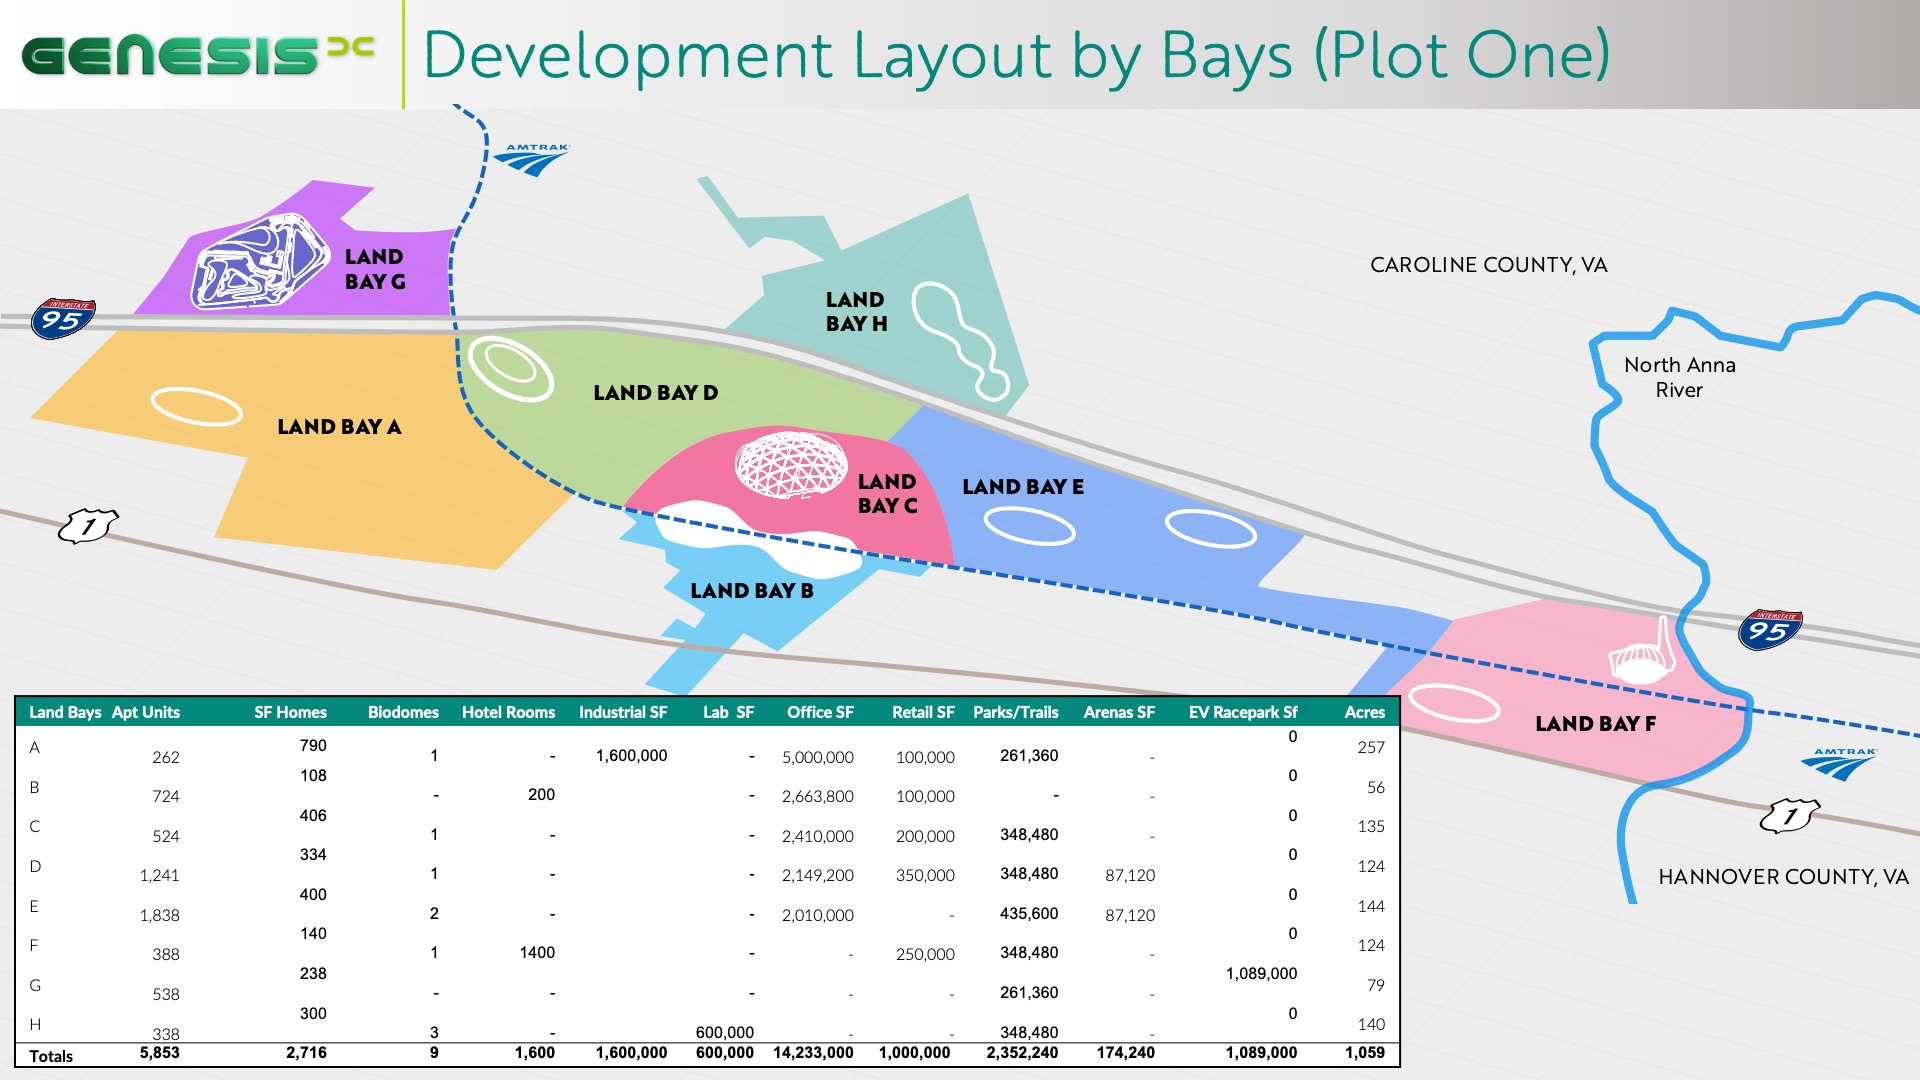
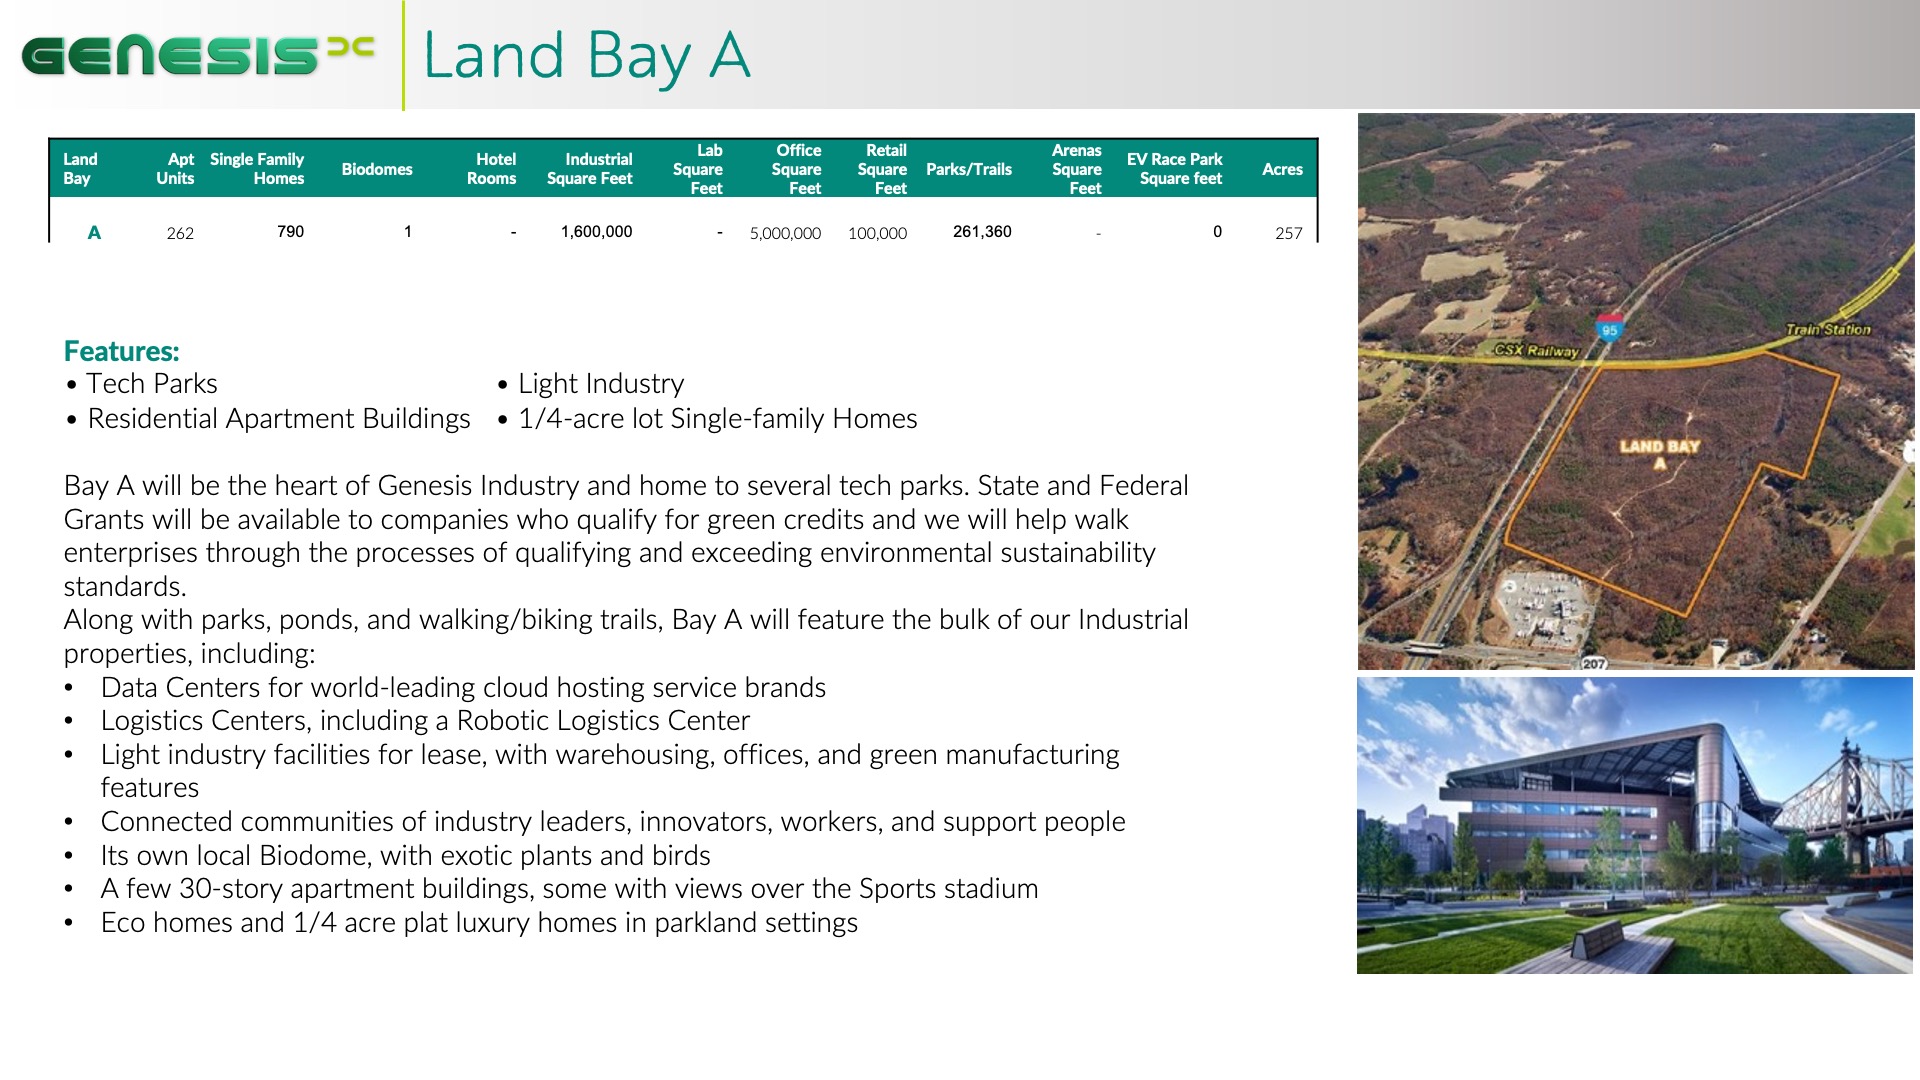
A similar problem was faced with the community sections, or Land Bays – How to visually display them as a geographic whole, yet allow interaction to explore each Bay.
Solution
A simple, illustrative diagram was produced for both the Regenerative Technologies and the Land Bays, with clickable icons or geographic color-coded boundaries that pulled up slide-in popup panels with further information.
A similar but simpler system was used on the website, with eight color-coded flip tiles replacing the circular diagram for the Technologies section and eight Land Bay buttons placed below a map overlay of the Land Bays for the geographic section.
Click on the carousel arrows to view the next diagram
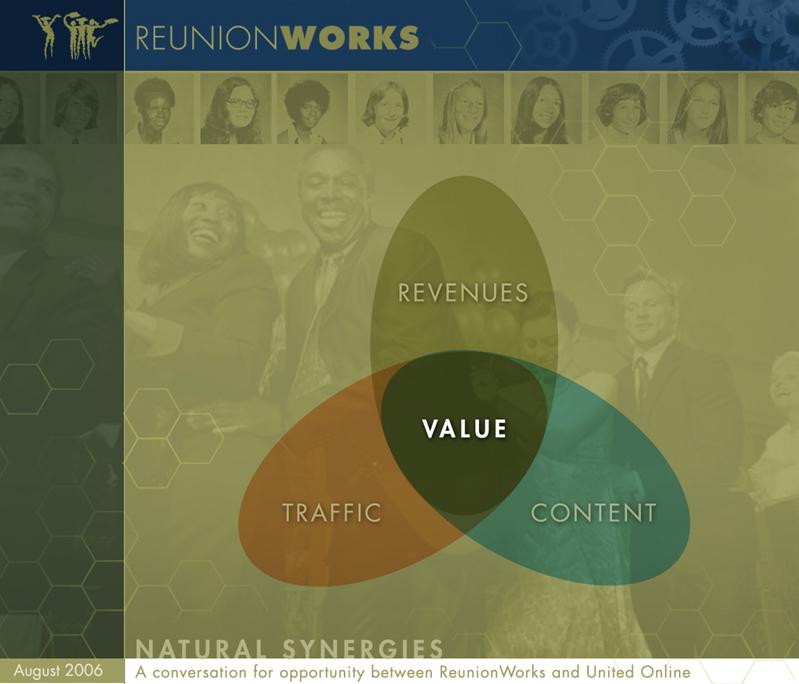
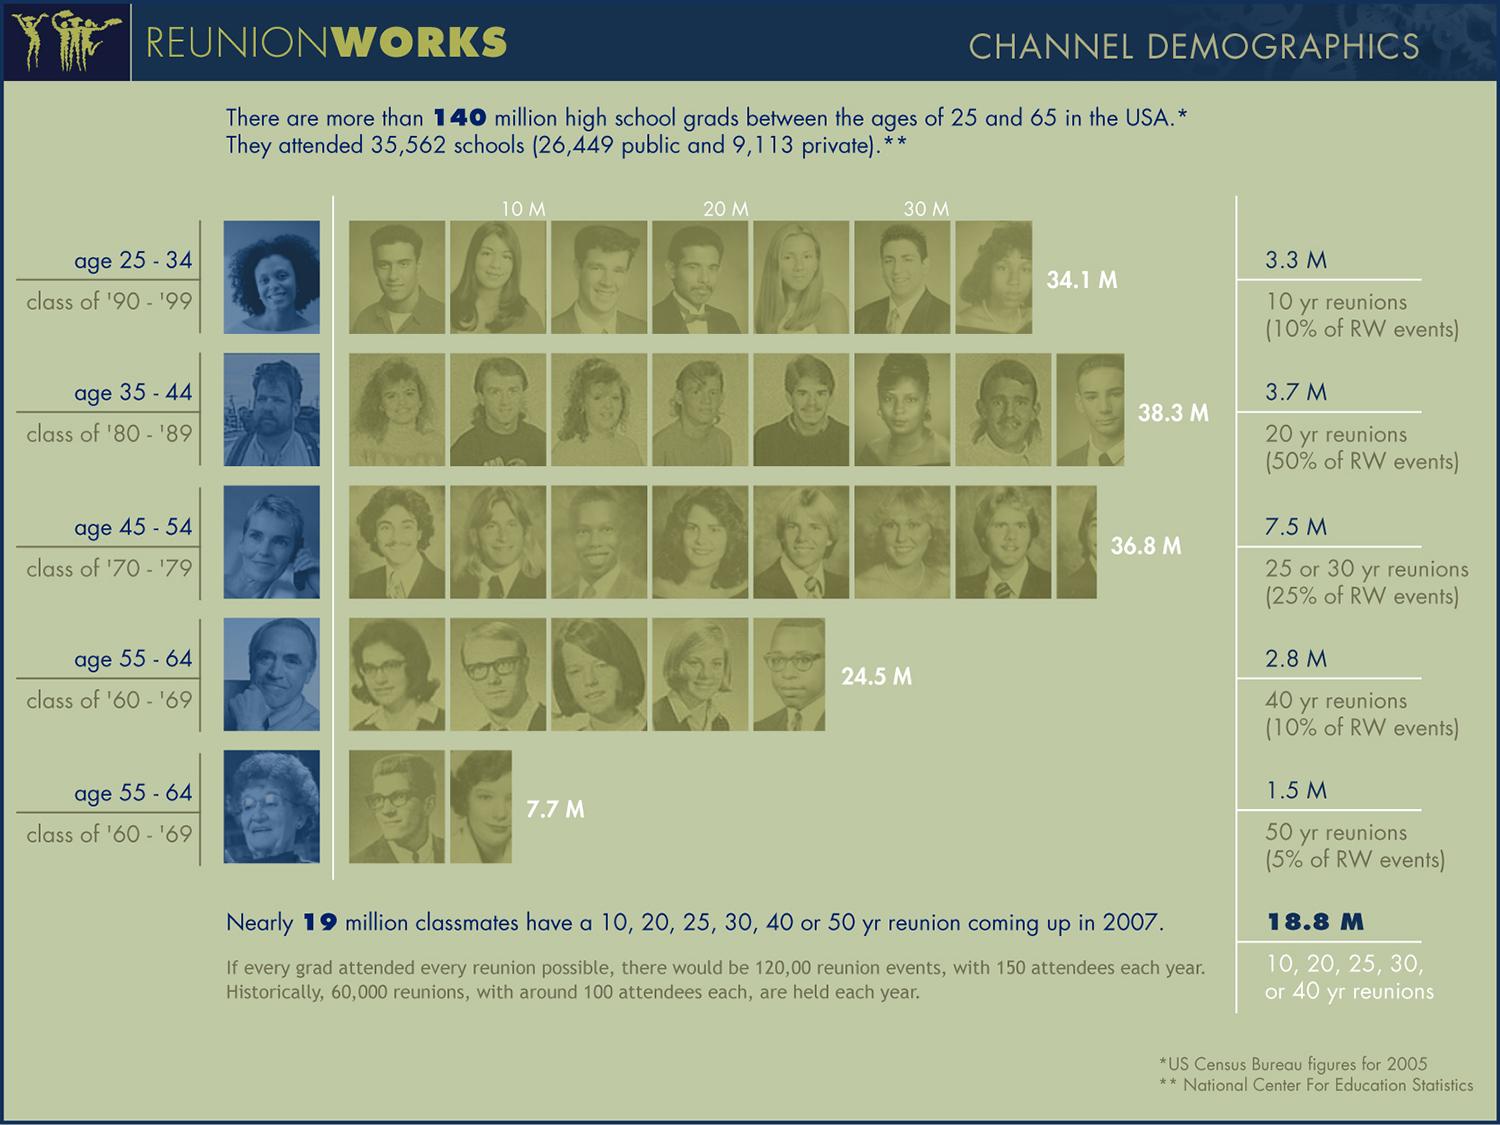
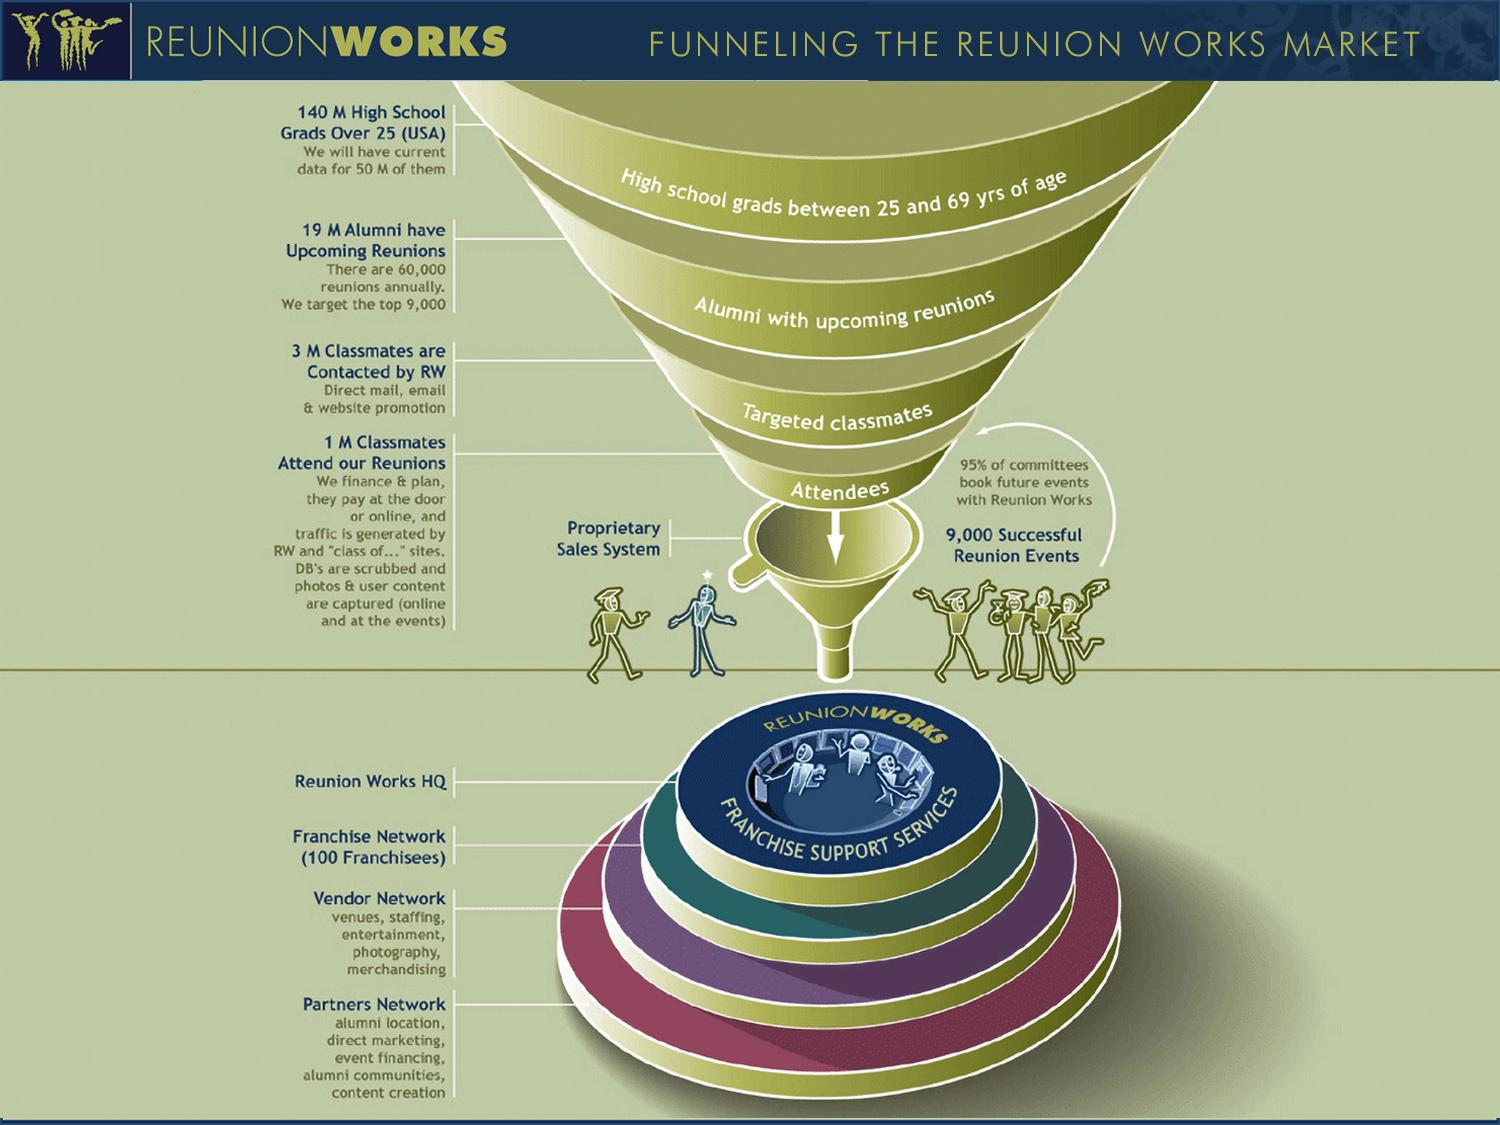
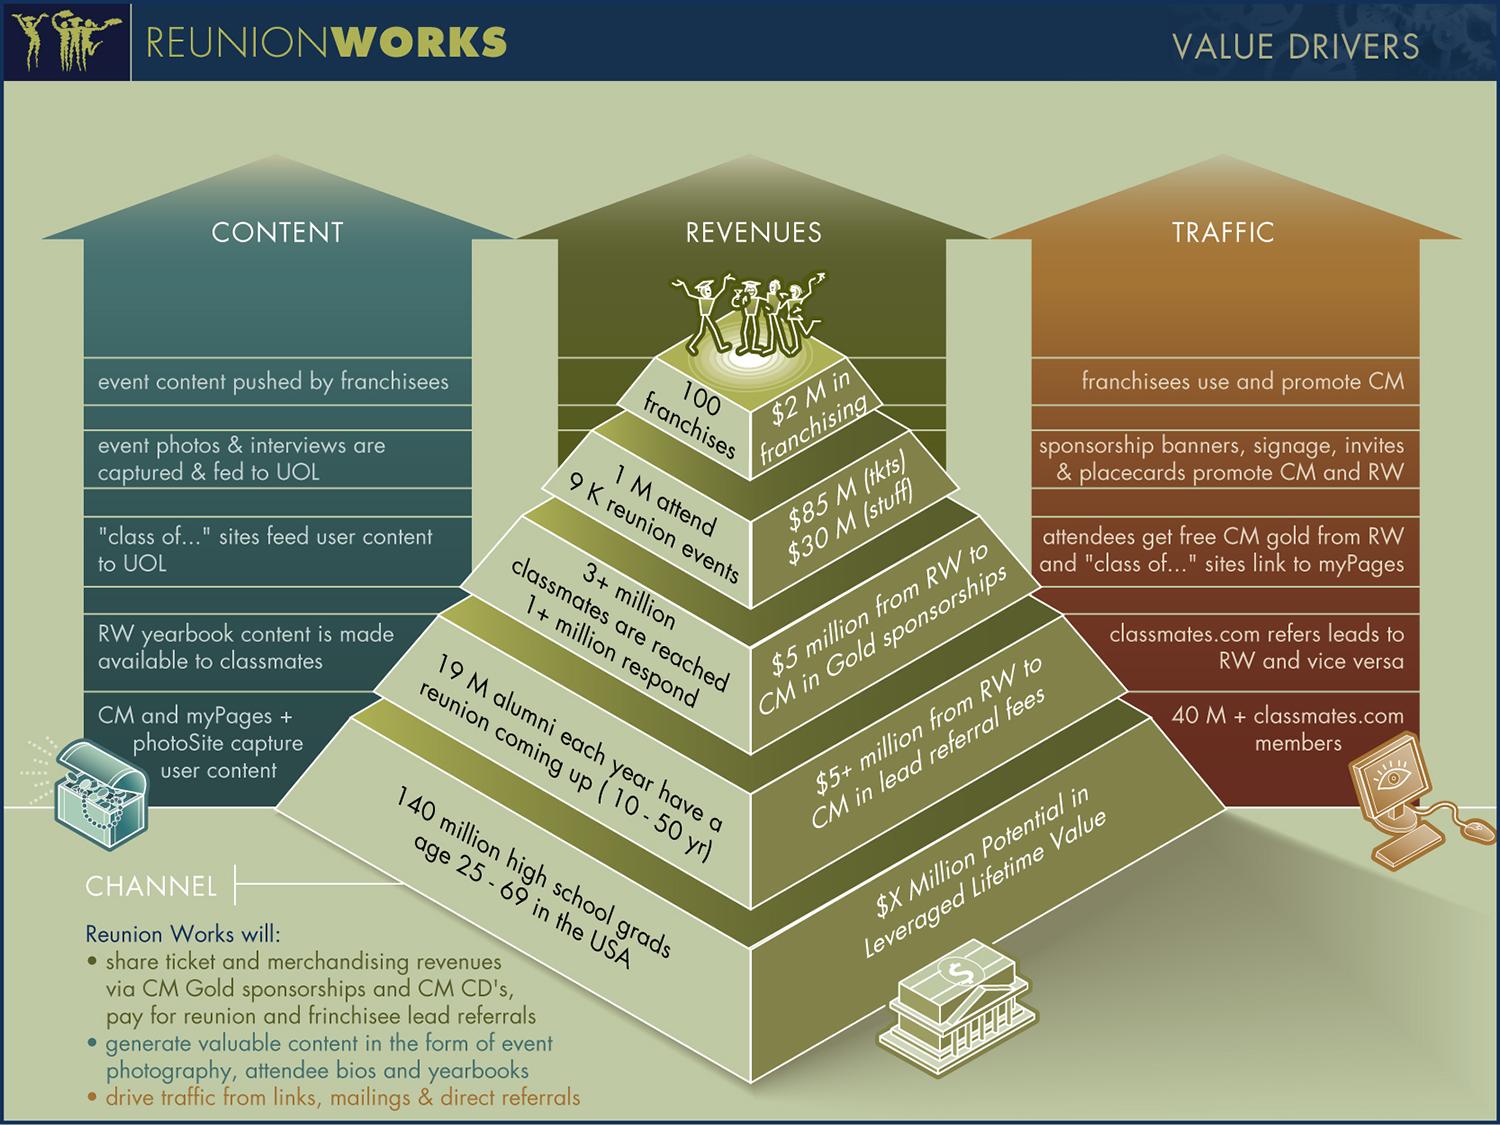
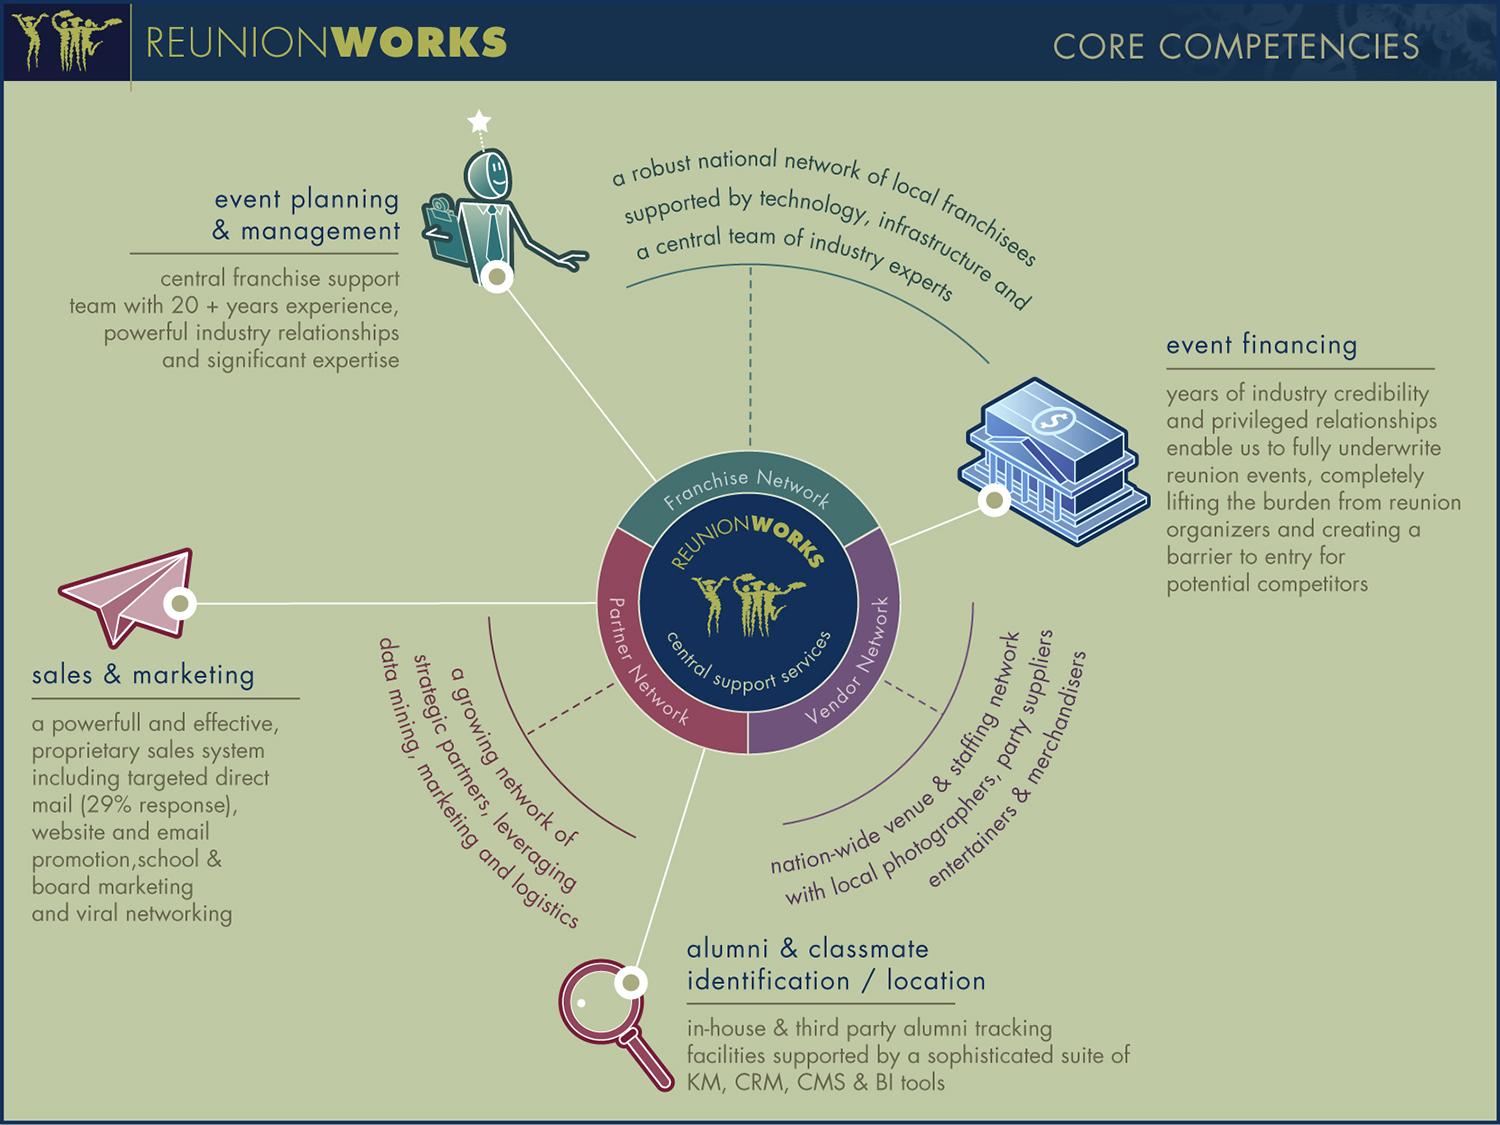
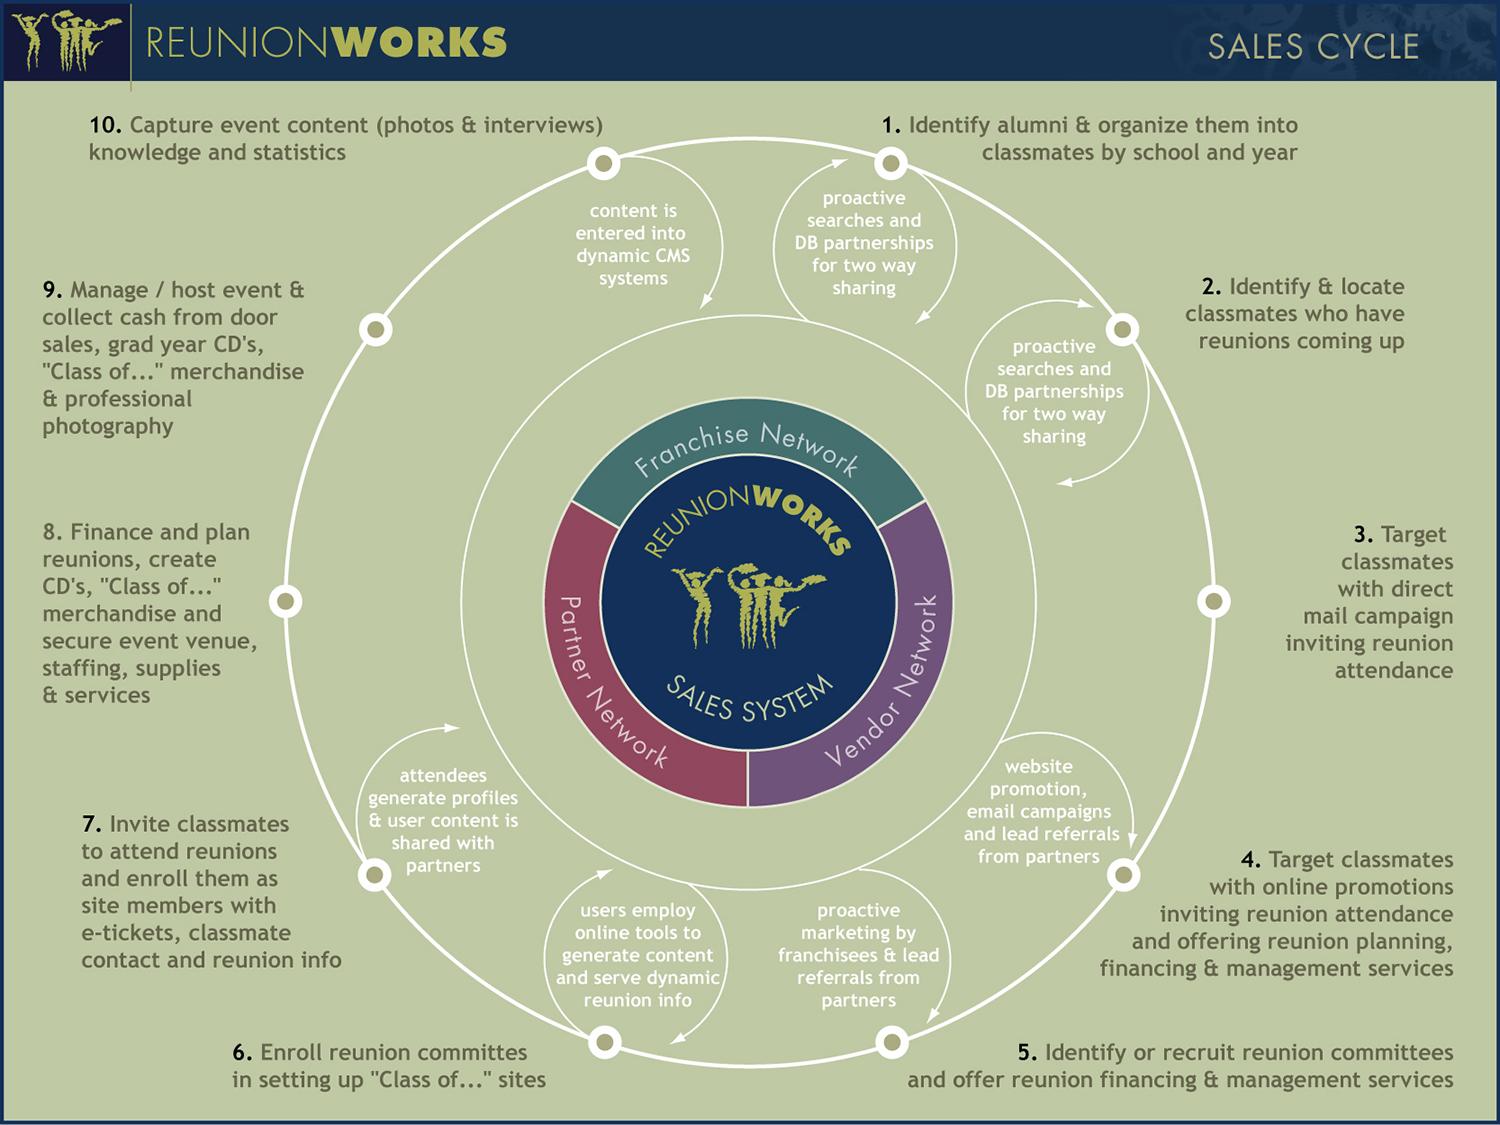
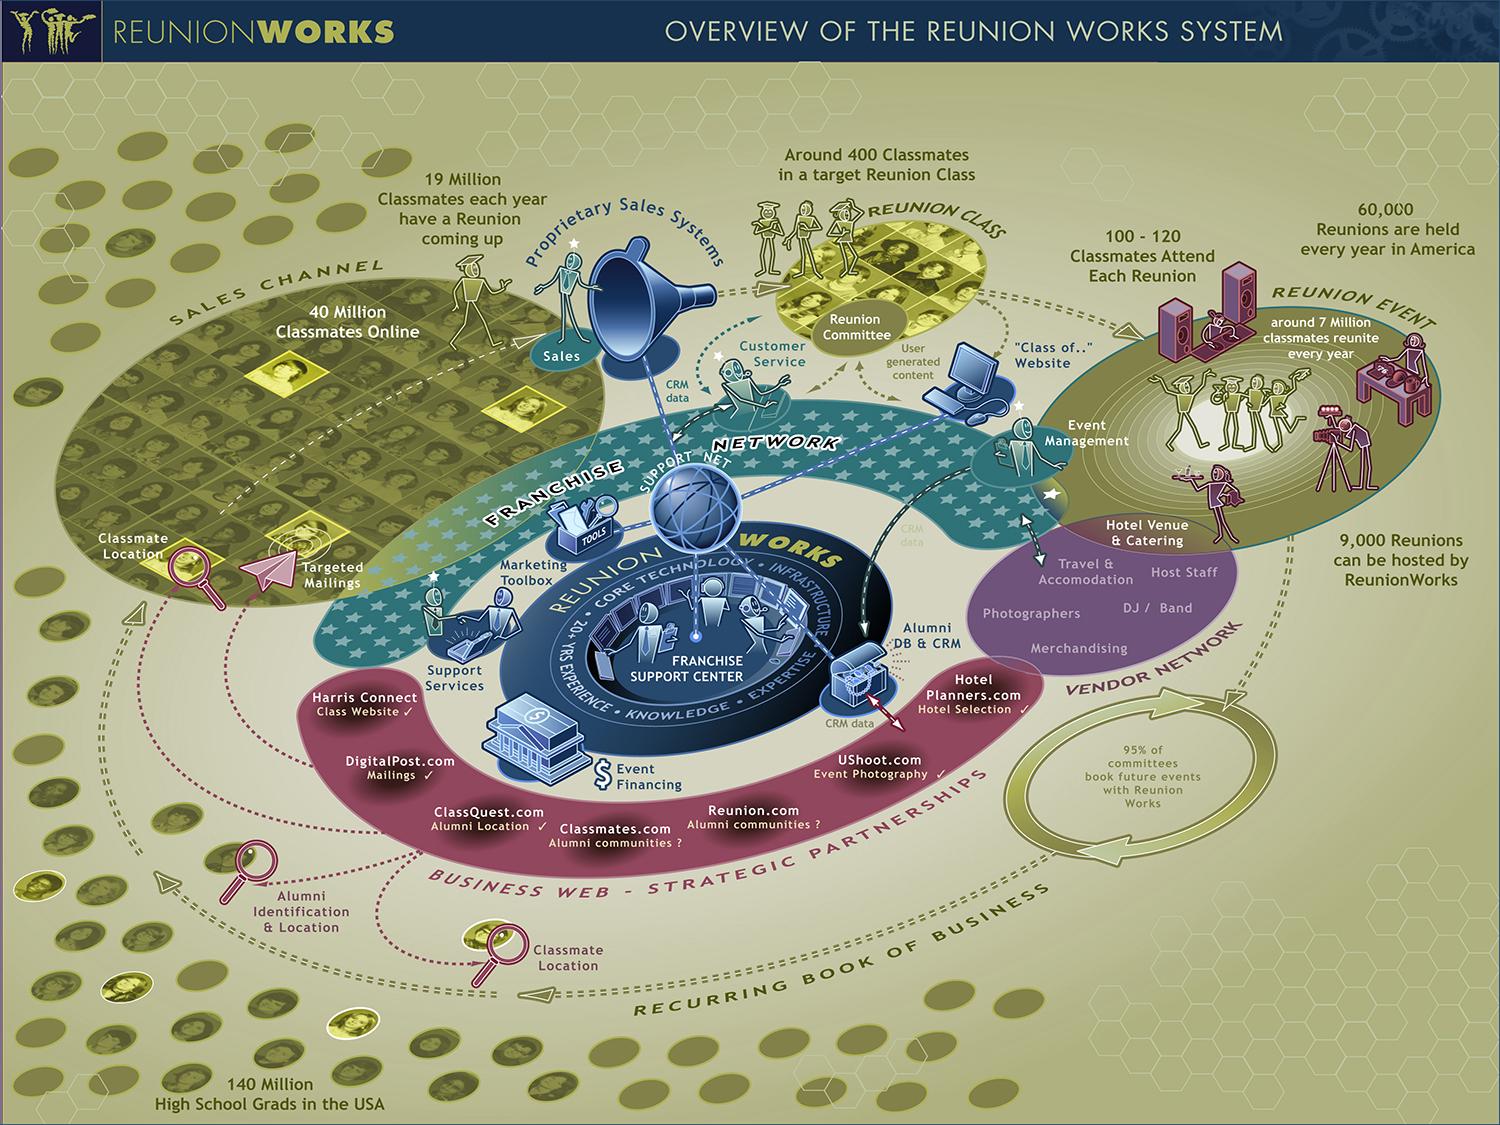
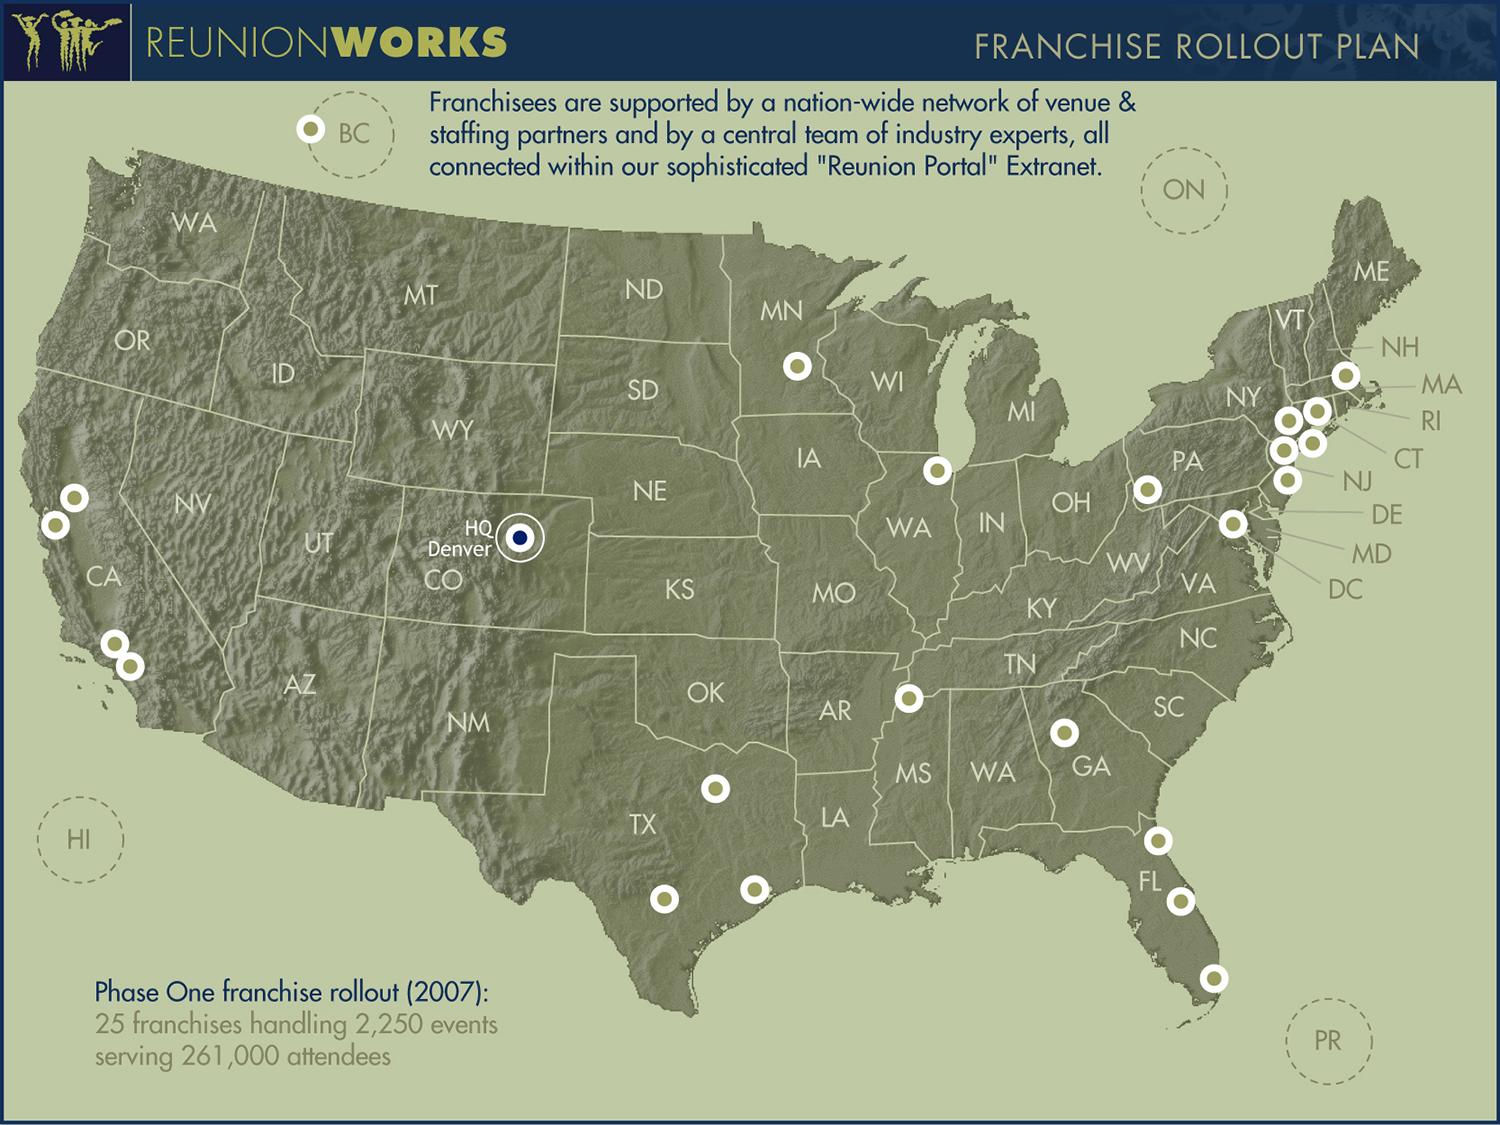
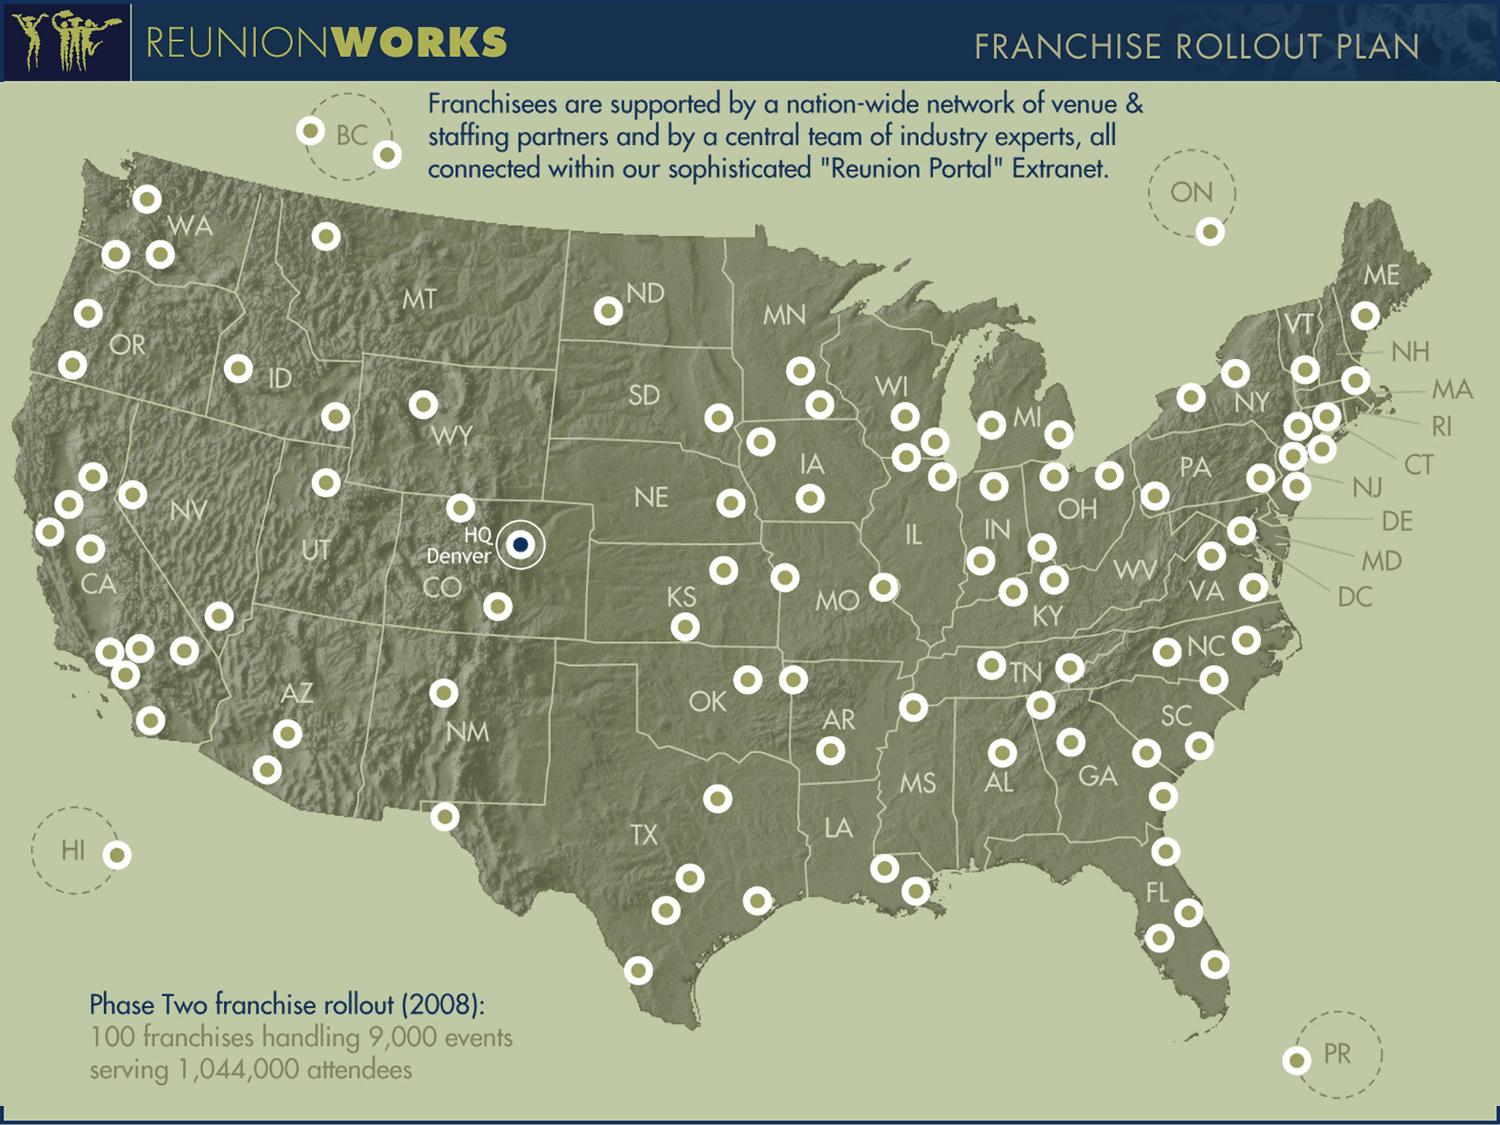
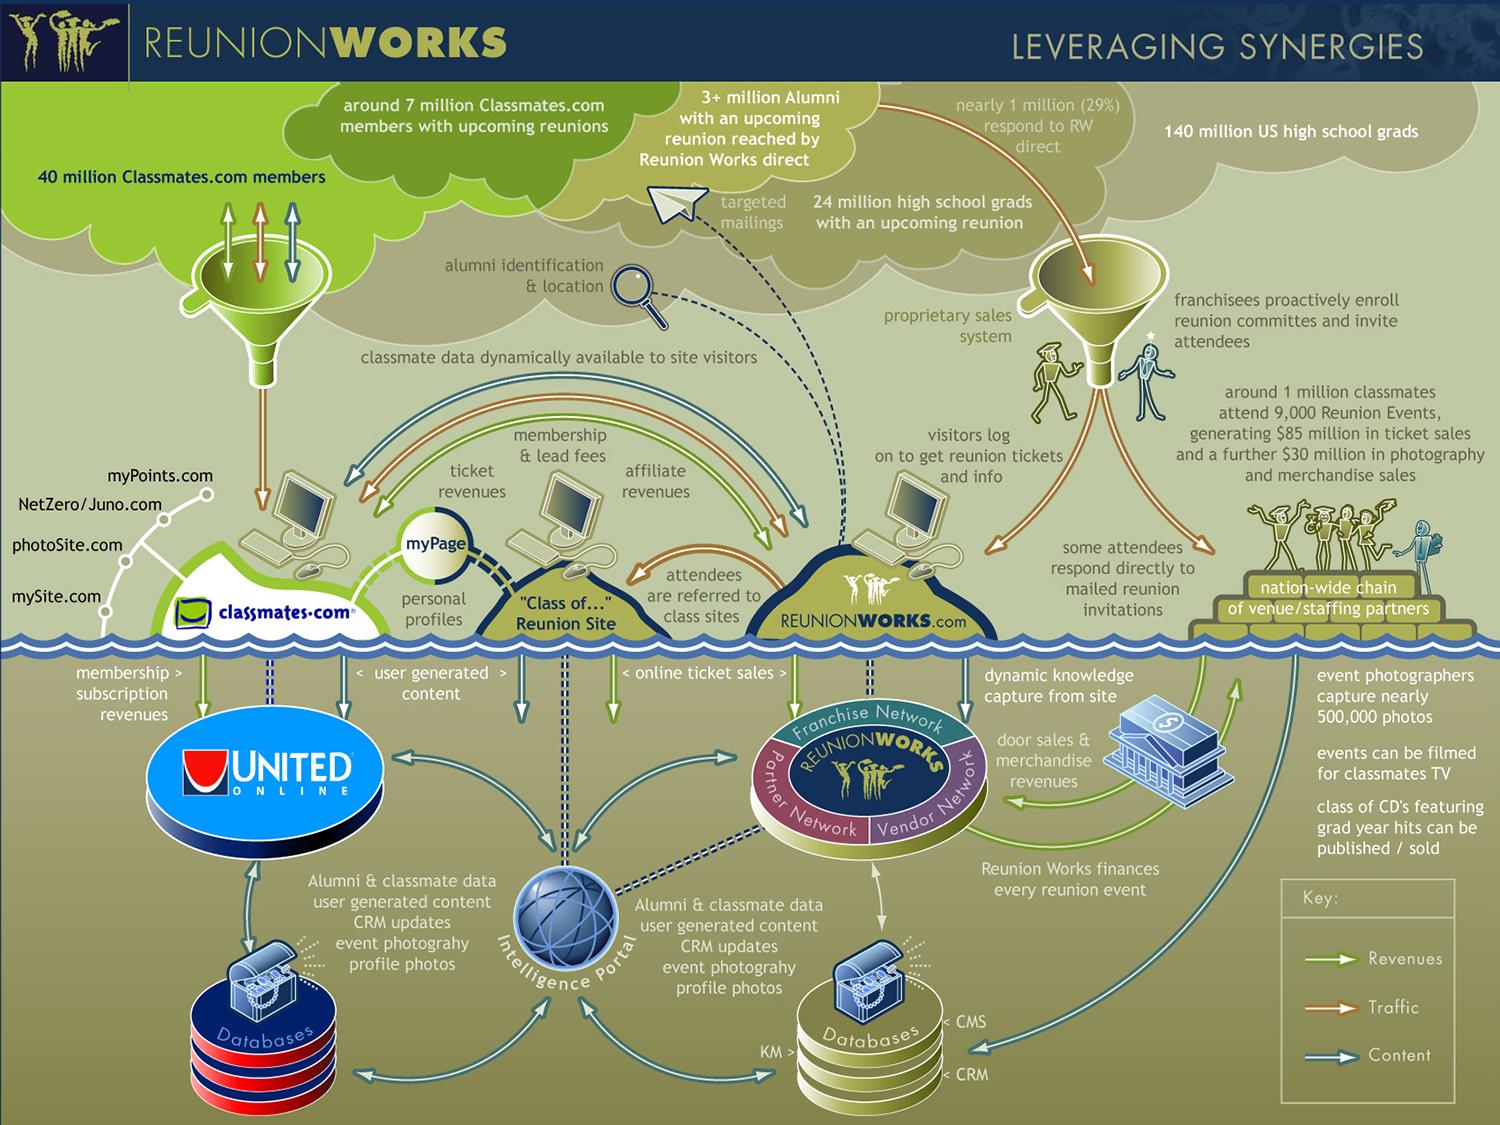
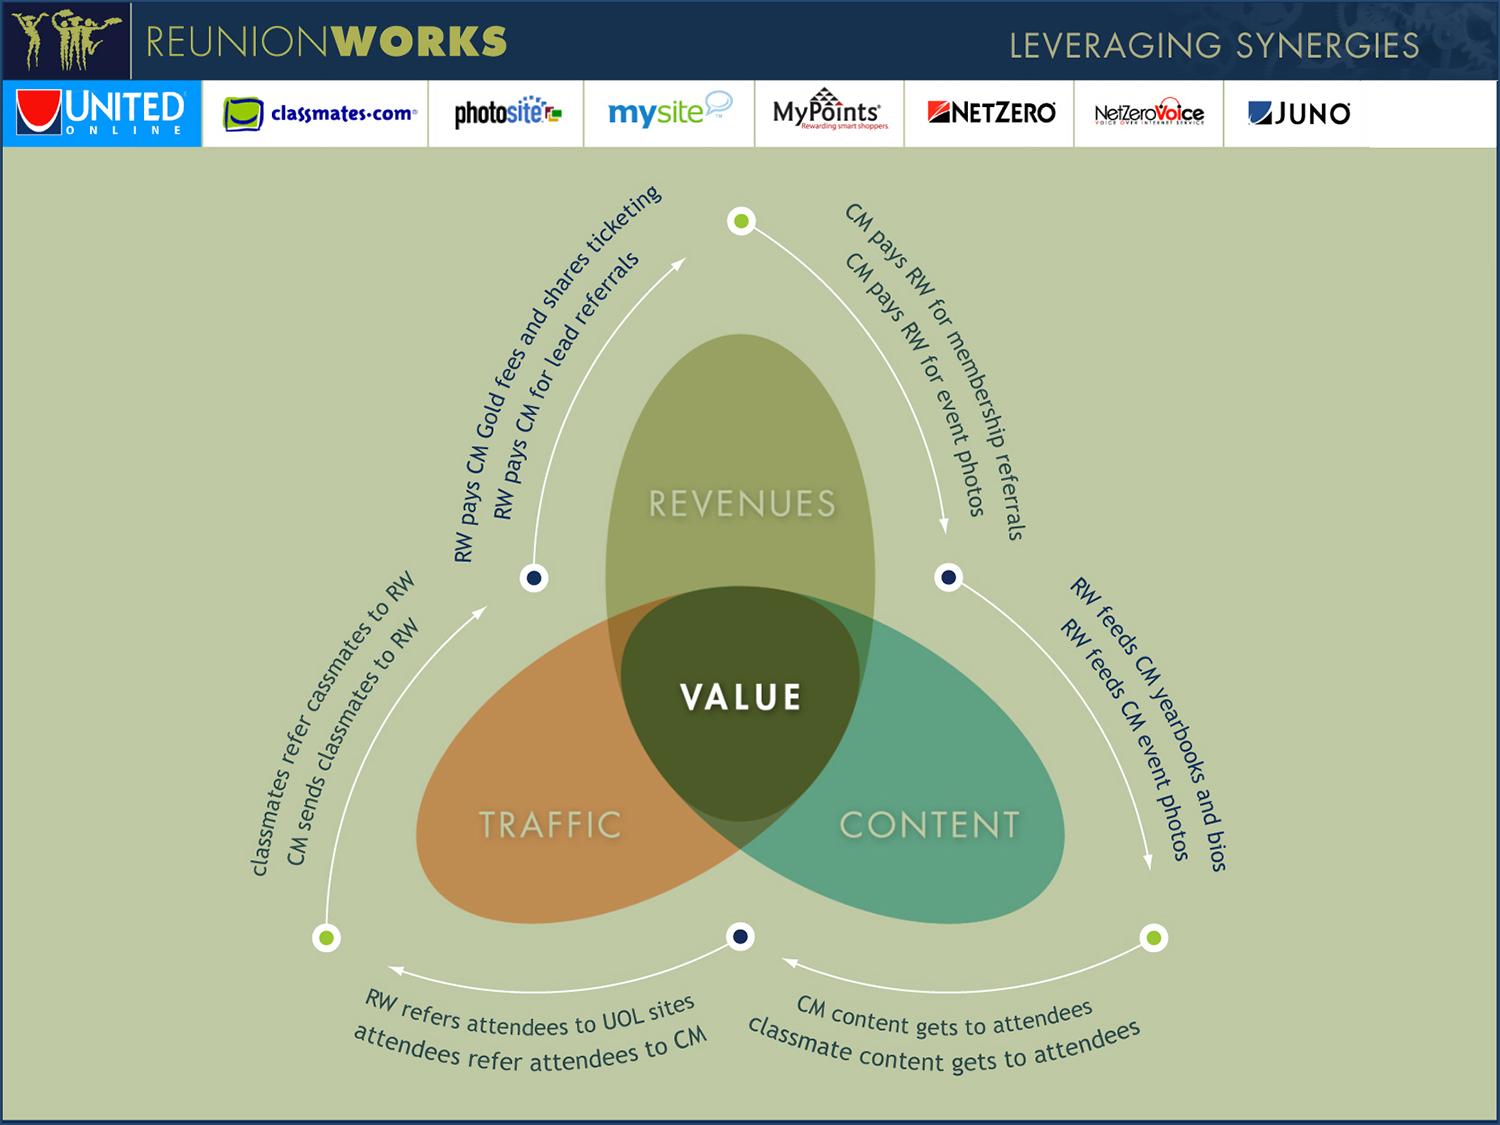
REUNION WORKS: Business model and strategic partner presentation diagrams
Rationale:
Reunion Works was a startup catering to the nearly 19 million annual high school and college reunion goers in America. They needed to express friendliness and accessibility, yet trustworthiness and organizational prowess, and the founder preferred muted pastel colors.
A logo concept sheet was produced and the winning concept developed into a brand system.
A distinctive diagram palette and style were developed to extend branding consistently across all communications.
Click on the carousel arrows to view the next diagram (Click image to view slides larger)
Previous
Next
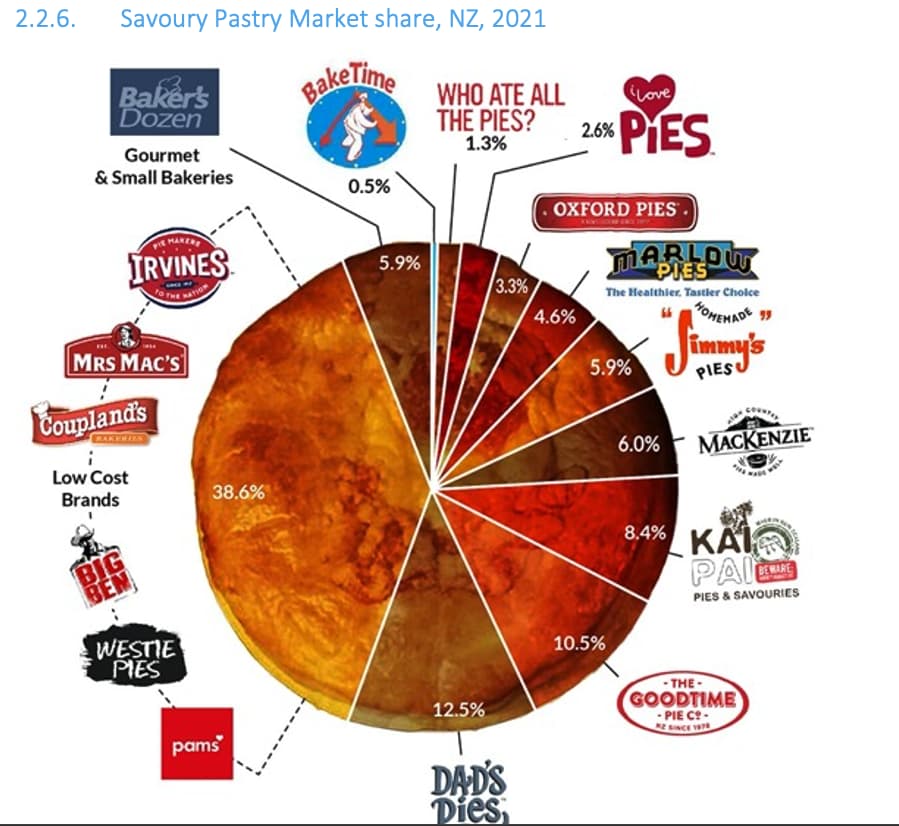
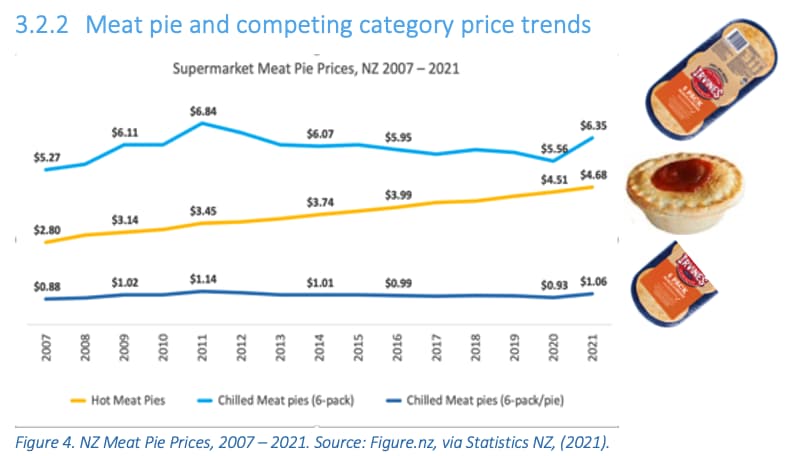
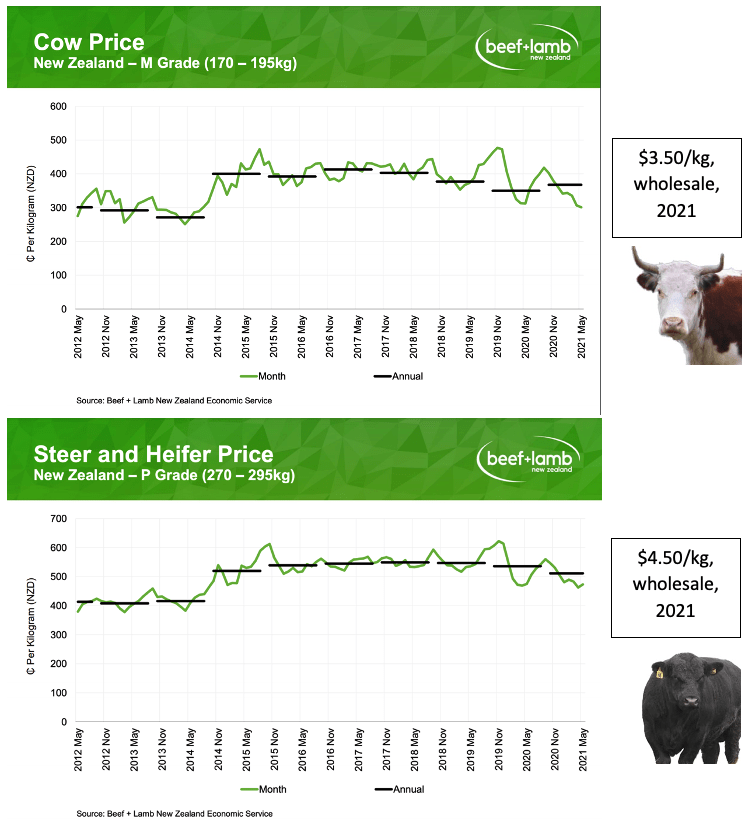
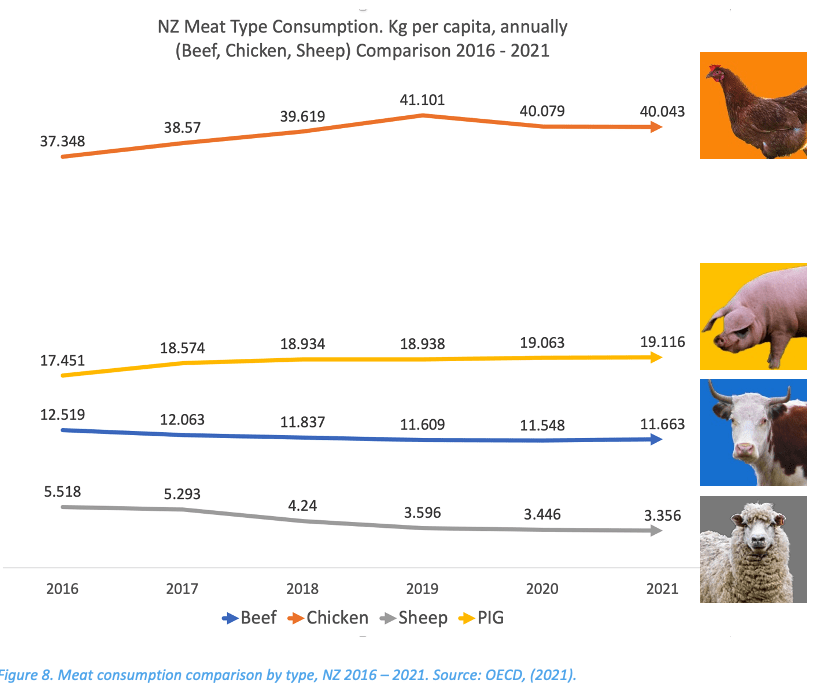
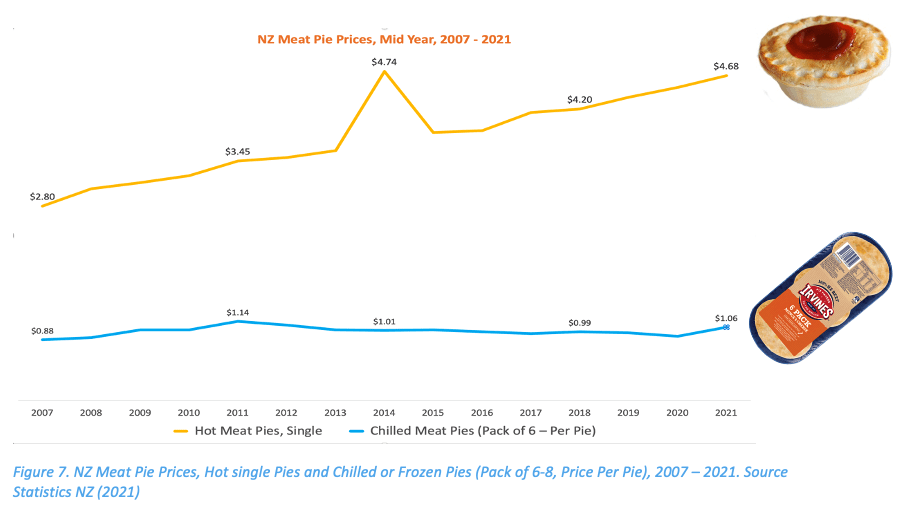
BAKETIME PIES: Various marketing charts
Rationale:
Baketime Pies requested a comprehensive situational analysis and marketing plan to inform their growth and new market penetration strategies. My team conducted secondary research through accredited sources and compiled various graphs and charts to illustrate key aspects of the plan, the market, and the competition.
Click on the carousel arrows to view the next diagram (Click image to view slides larger)
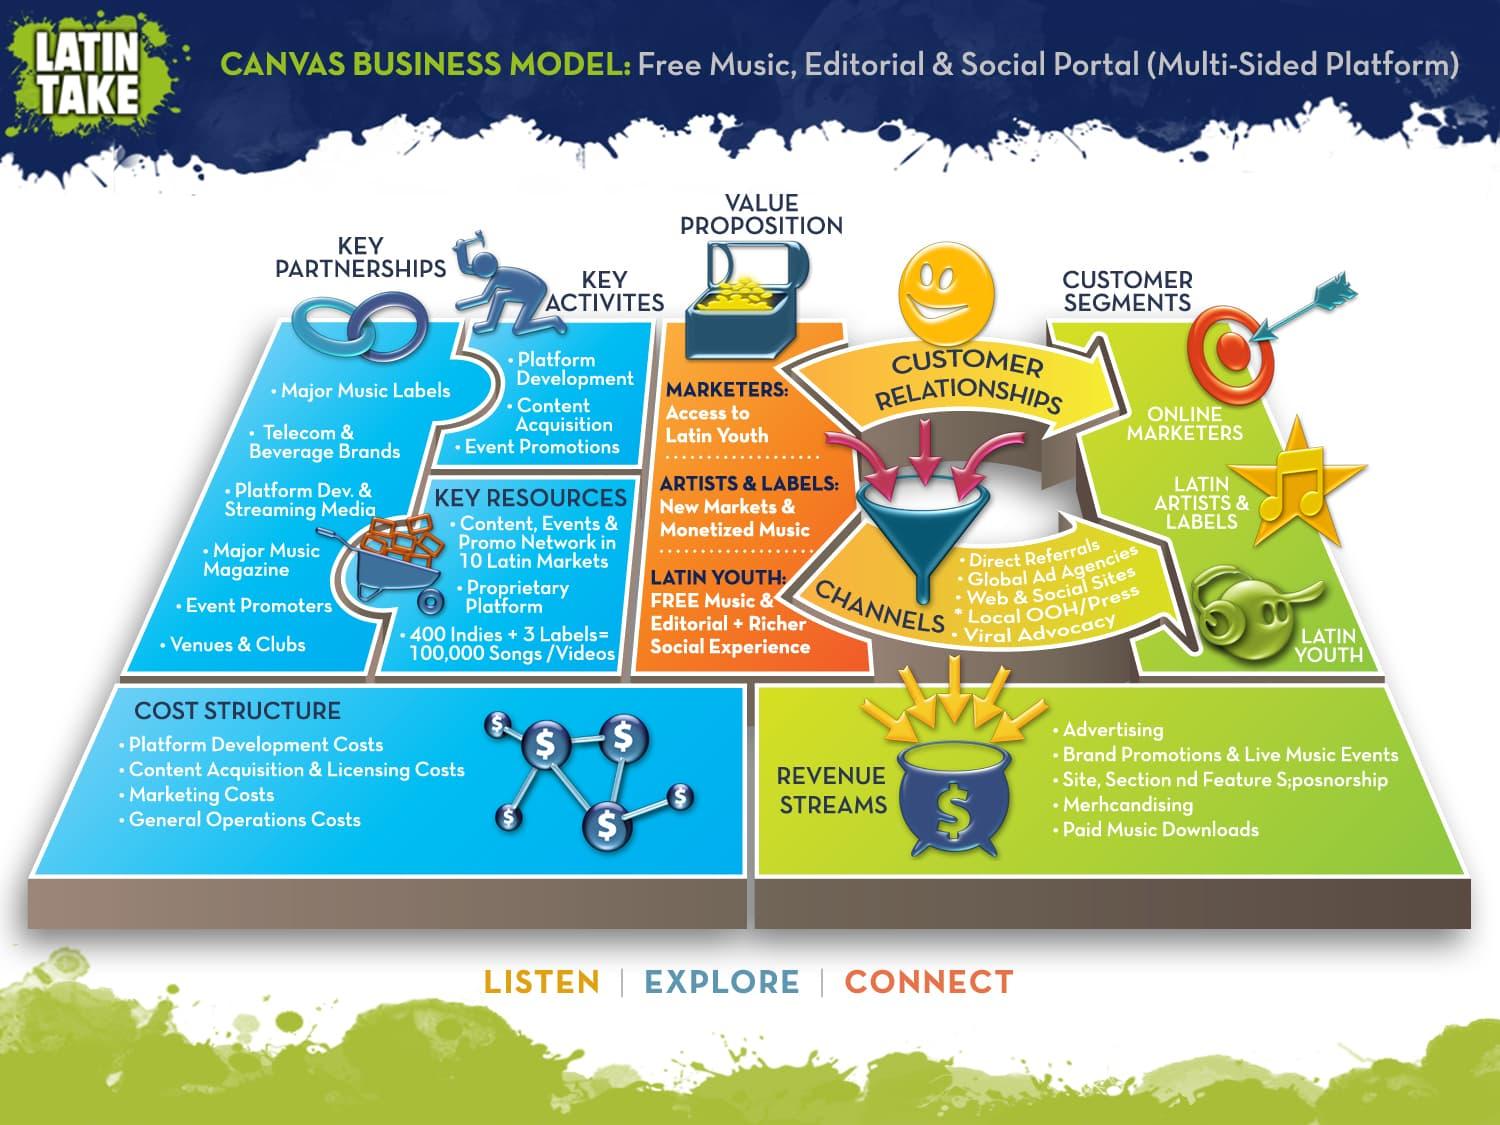
LATINTAKE: Investor and stakeholder presentations, and CANVAS business model
Problem:
Latintake was a Latin music portal startup offering licensed Latin American music from the big labels as well as self-published videos from emerging artists. The site aimed to integrate journalism content from music writers from 17 countries in Central and South America, as well as a viewer-voting new music video competition.
The logo was a dynamic and energetic splash of vibrant lime green against navy, and a unique, glassy 3D style was developed for corporate diagrams and presentation icons. An interactive canvas model was produced, that walked stakeholders through a step-by-step explanation of key aspects of the business plan.
Click on the carousel arrows to view the next diagram
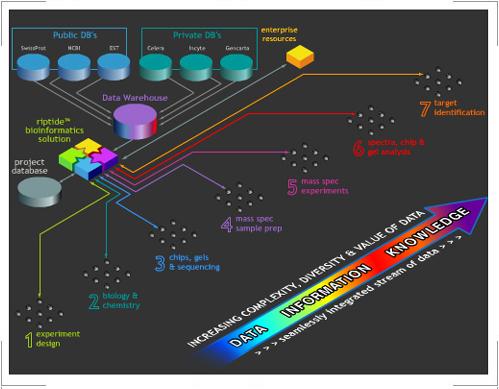
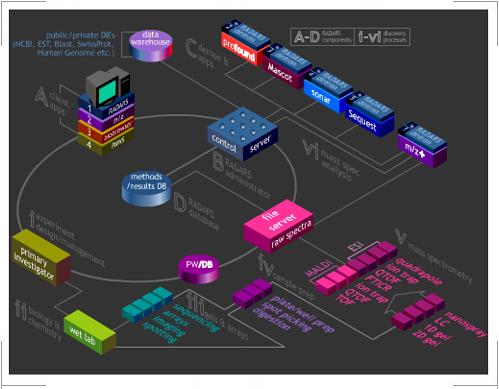
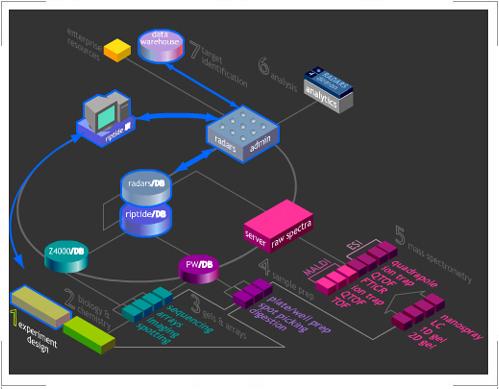
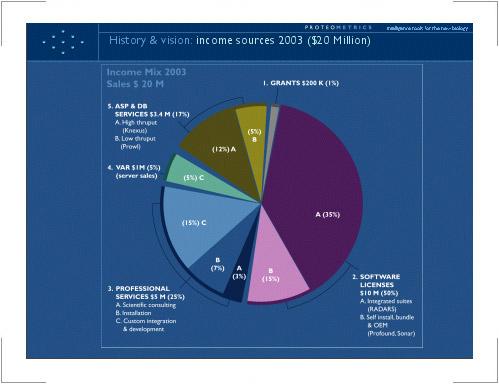
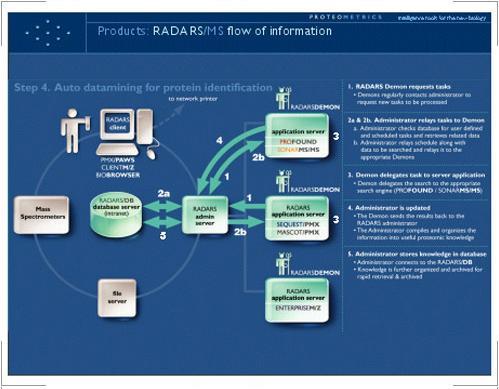
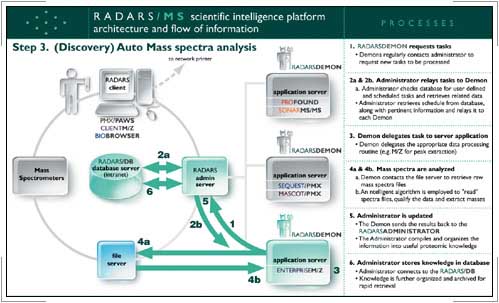
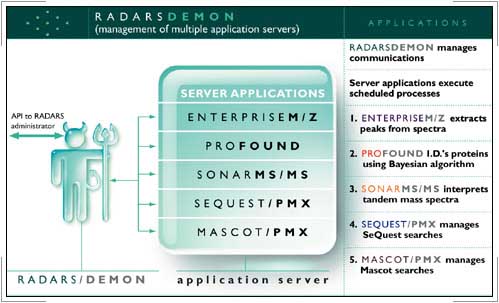
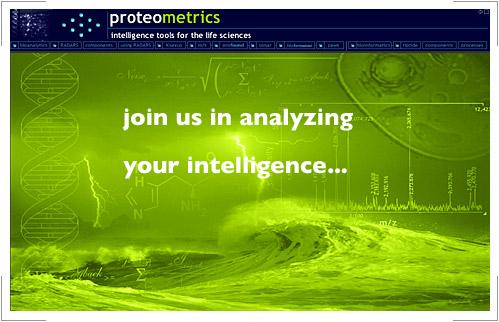
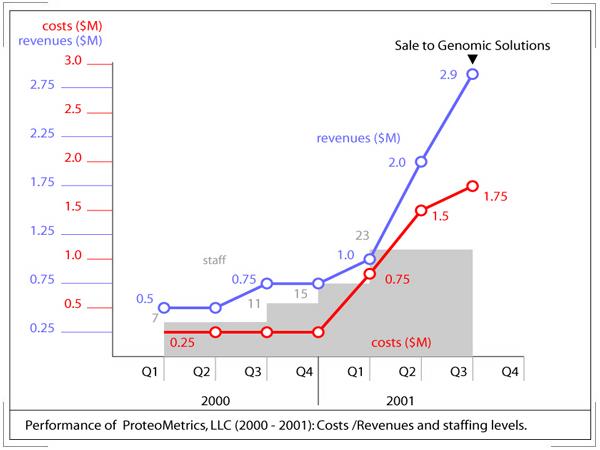
PROTEOMETRICS: Stakeholder and Strategic Partner Diagrams
Rationale:
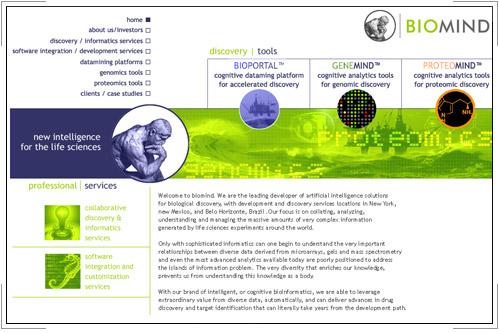
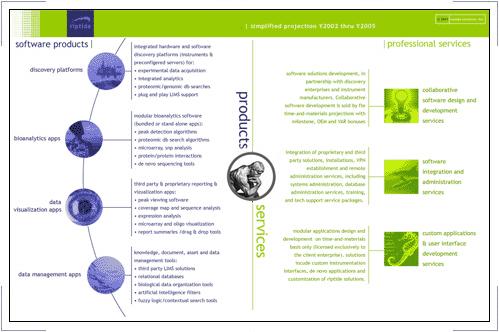
Proteometrics was a small New York bioinformatics firm offering groundbreaking software that significantly reduced the time it took scientists to search databases in mass spectrometry operations of drug research.
I rebranded the firm with a striking logo representing the gel matrix process at the heart of mass spectrometry. I then productized and branded their various applications into a suite of discrete apps and created communications collateral to visualize the value propositions and processes behind these products.
Click on the carousel arrows to view the next diagram.
SCHOOL NAMING RIGHTS: Business model.
Rationale:
School Naming Rights was a startup out of Fort Worth, Texas, that aimed to serve the nascent market for corporate sponsorship of school assets (Gymnasiums, libraries, sports fields, etc.). SNR owned a school newsletter publishing company, so had unique access to alumni and parents.
The business model had not yet been fully iterated so part of the diagram process involved brainstorming and resolving key networks and activities. The result was rendered as a 3D model and used successfully in investor and strategic partner presentations.
Click on the image for a high-resolution lightbox image.
Previous
Next
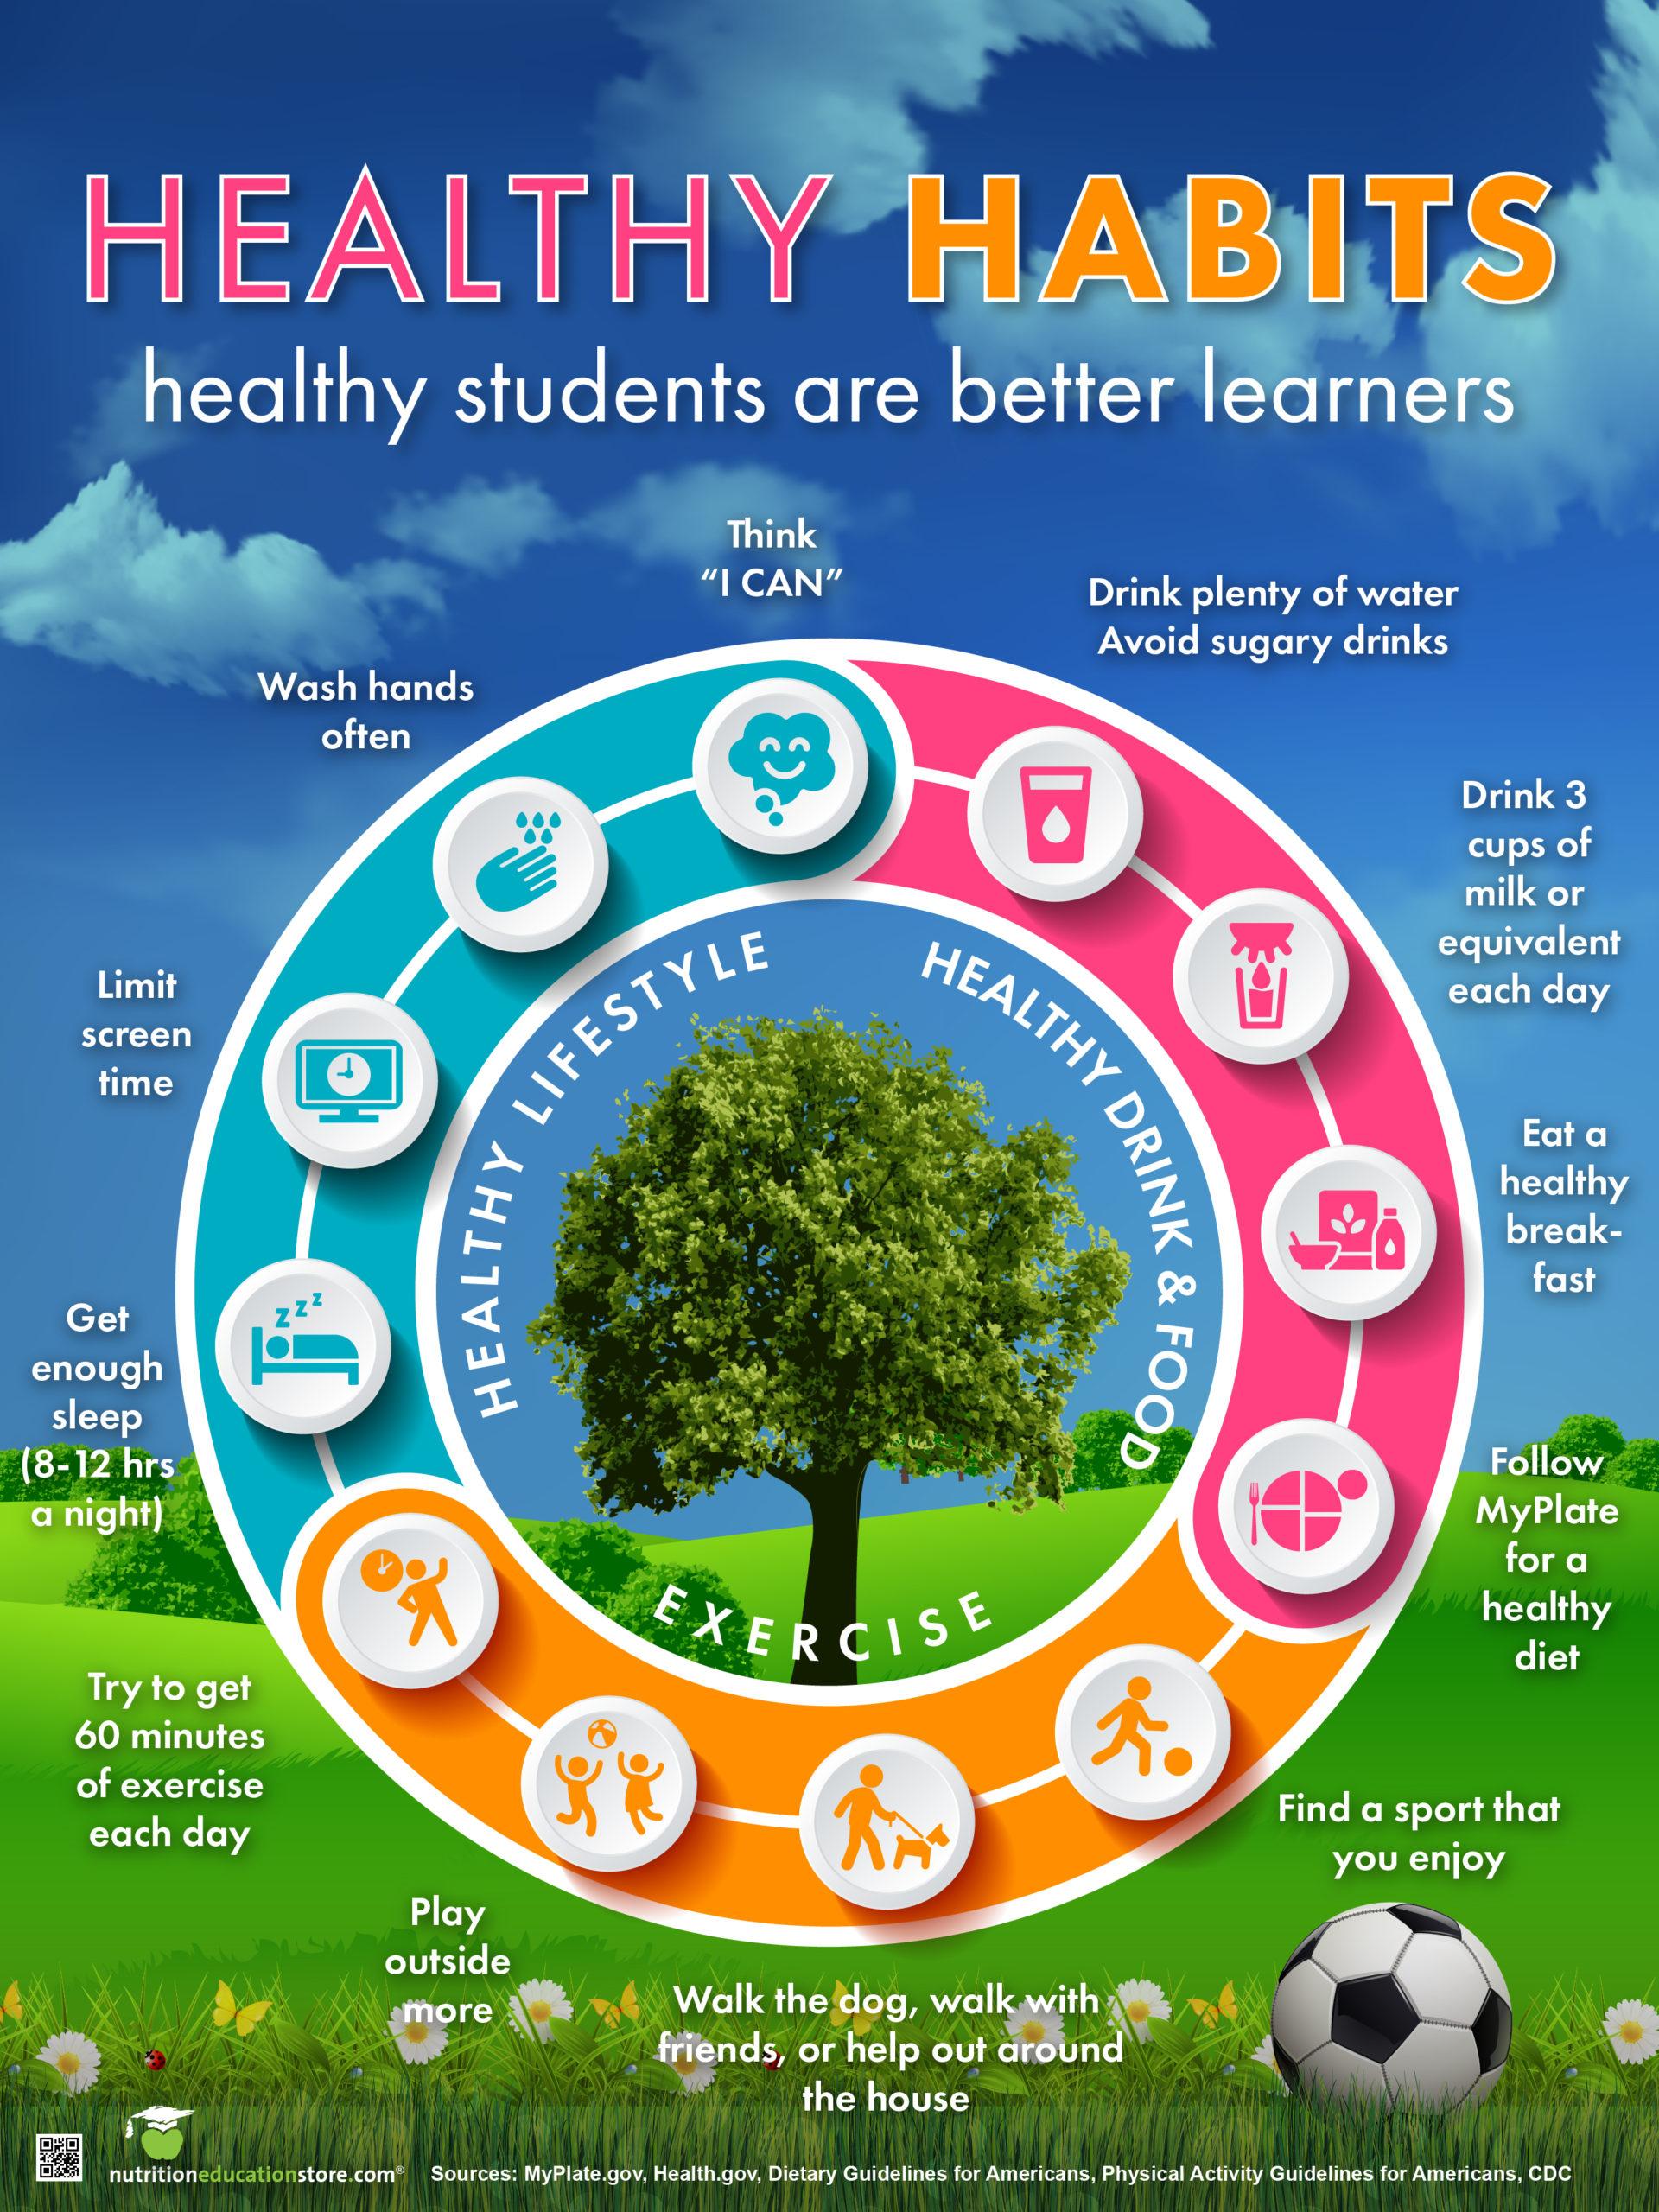
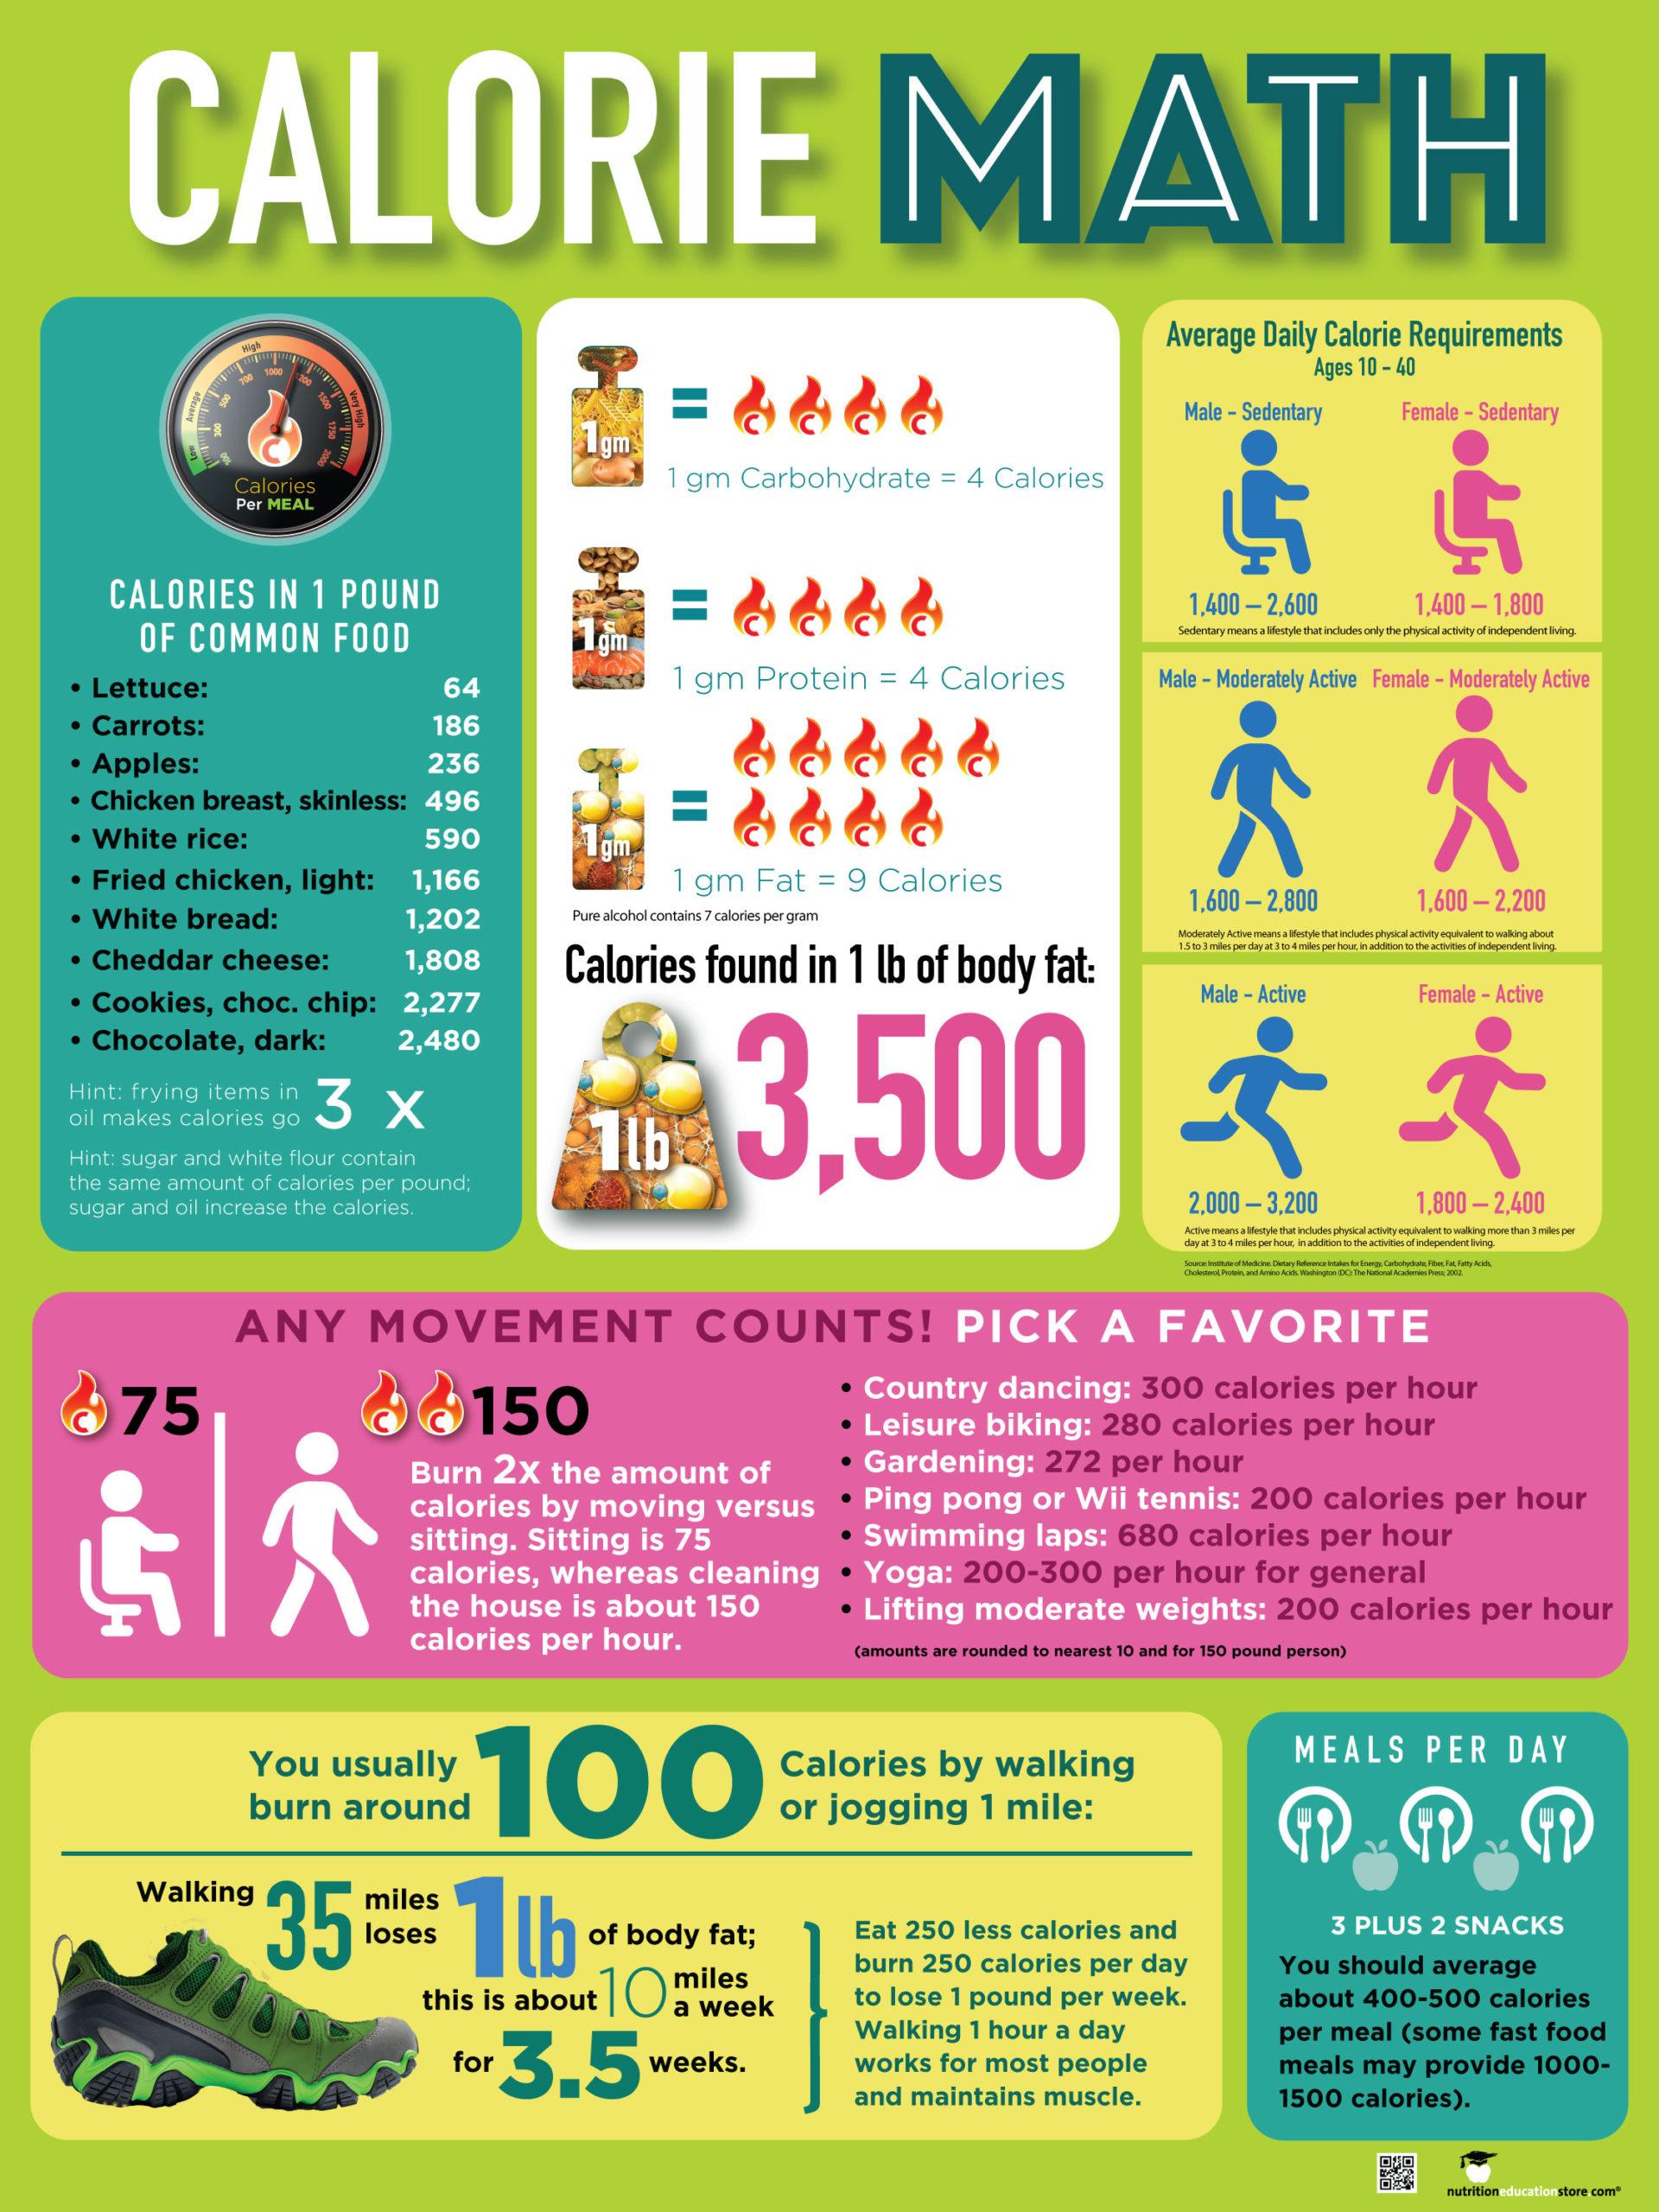
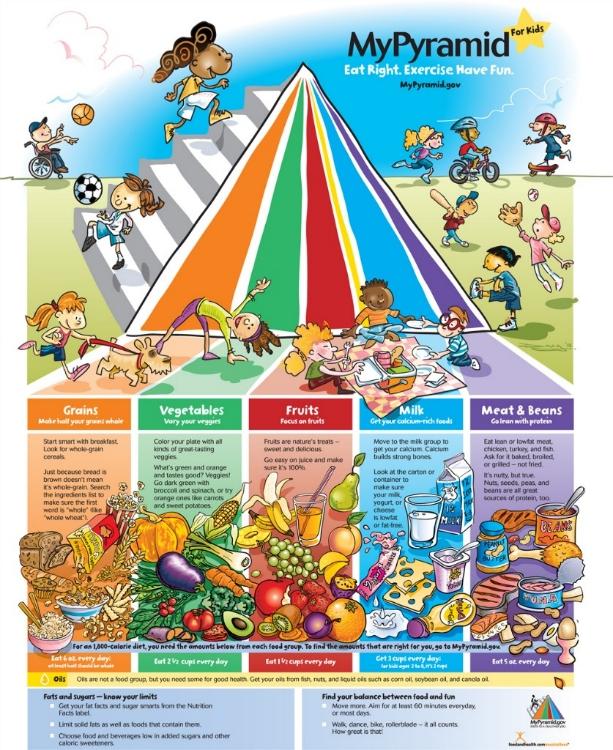
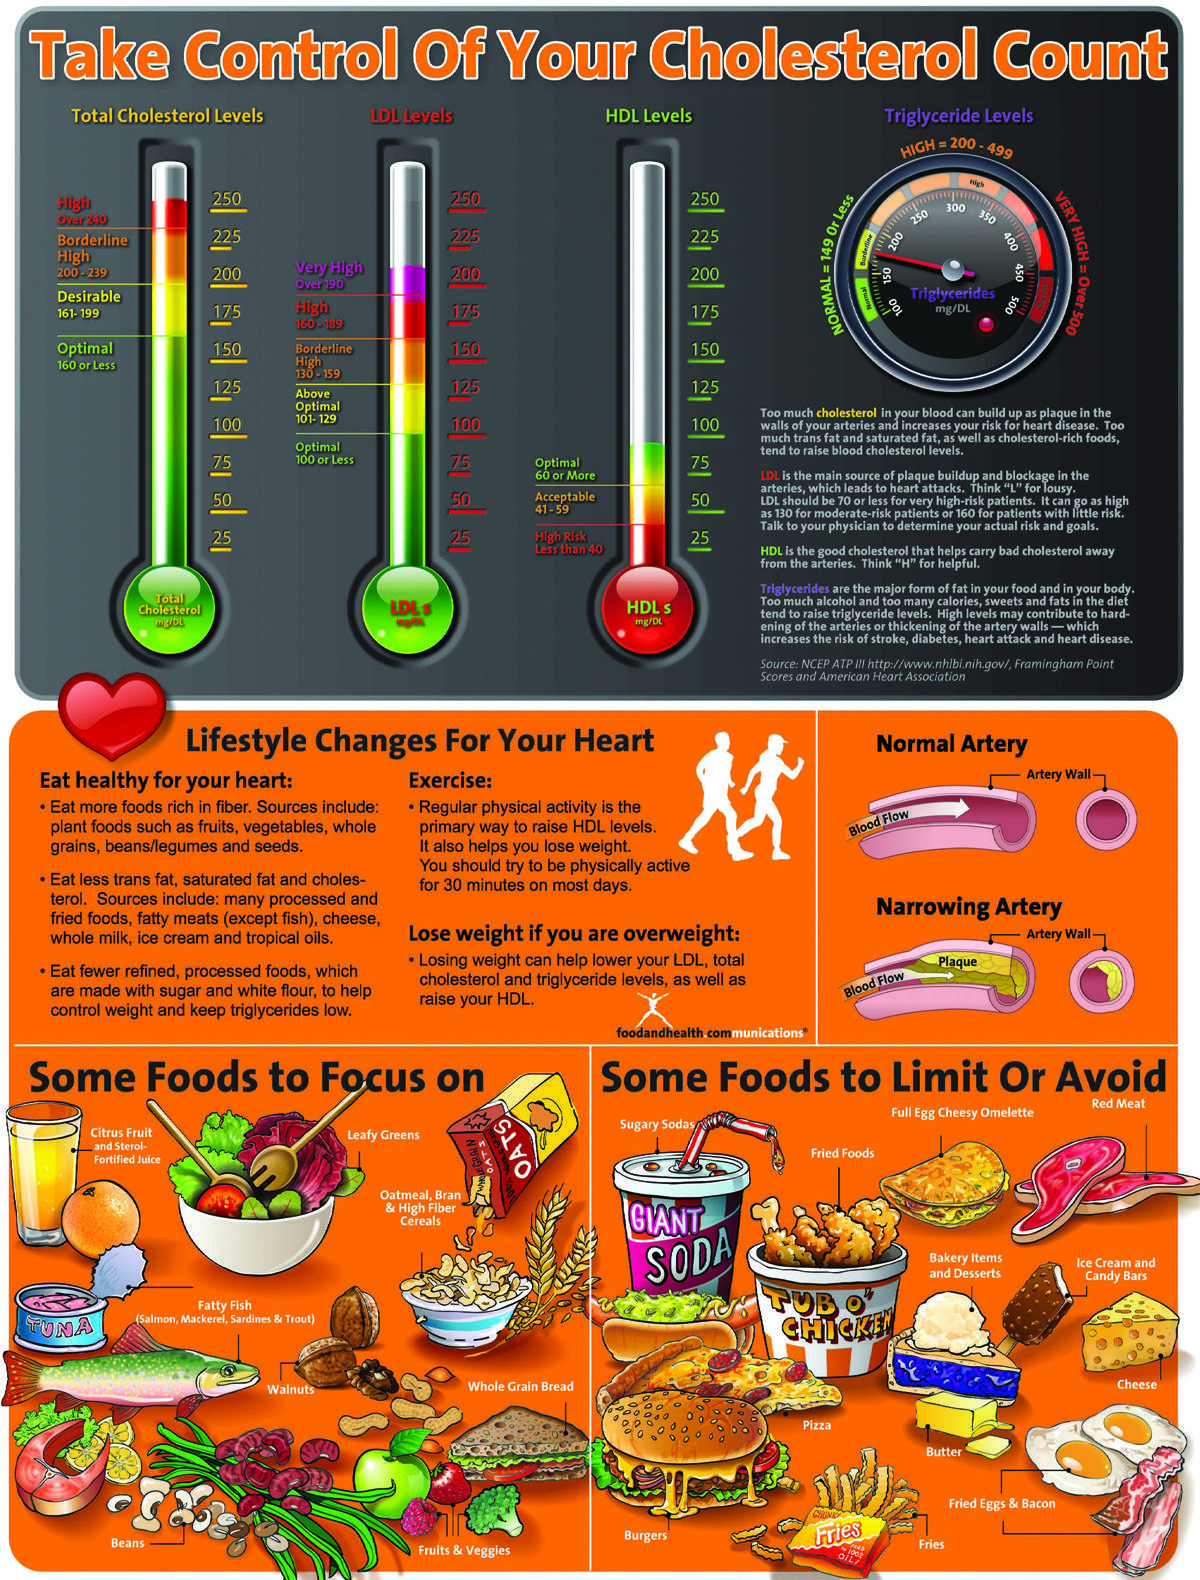
FOOD & HEALTH COMMUNICATIONS: Various Poster Diagrams and Infographics
Rationale:
FAH produces 20 + educational food and health awareness posters annually, many of which present their information as illustrative infographics or innovative charts.
Click on the carousel arrows to view the next chart.
Previous
Next
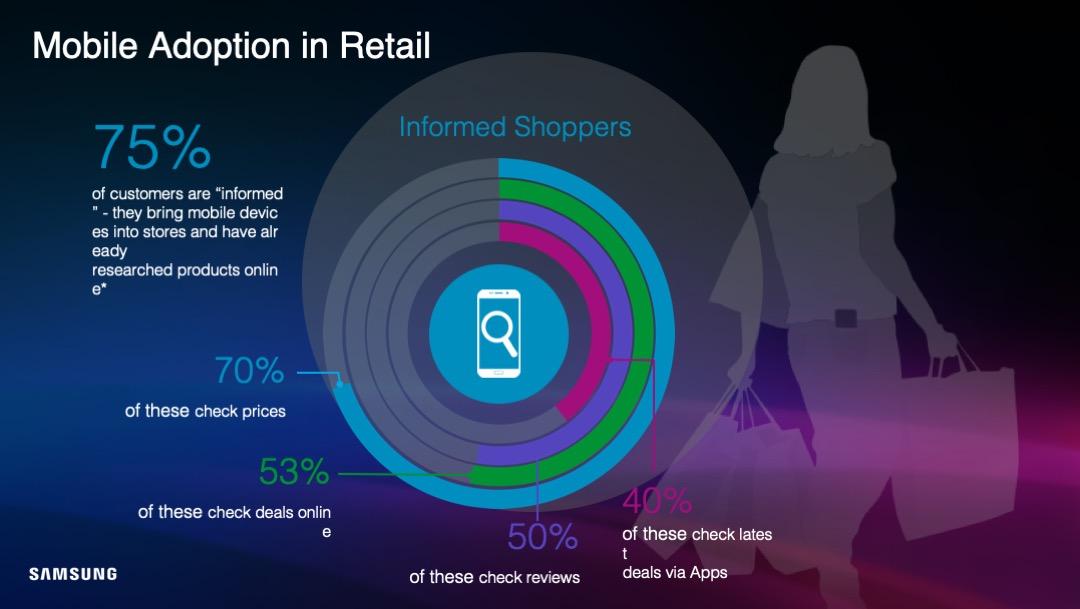
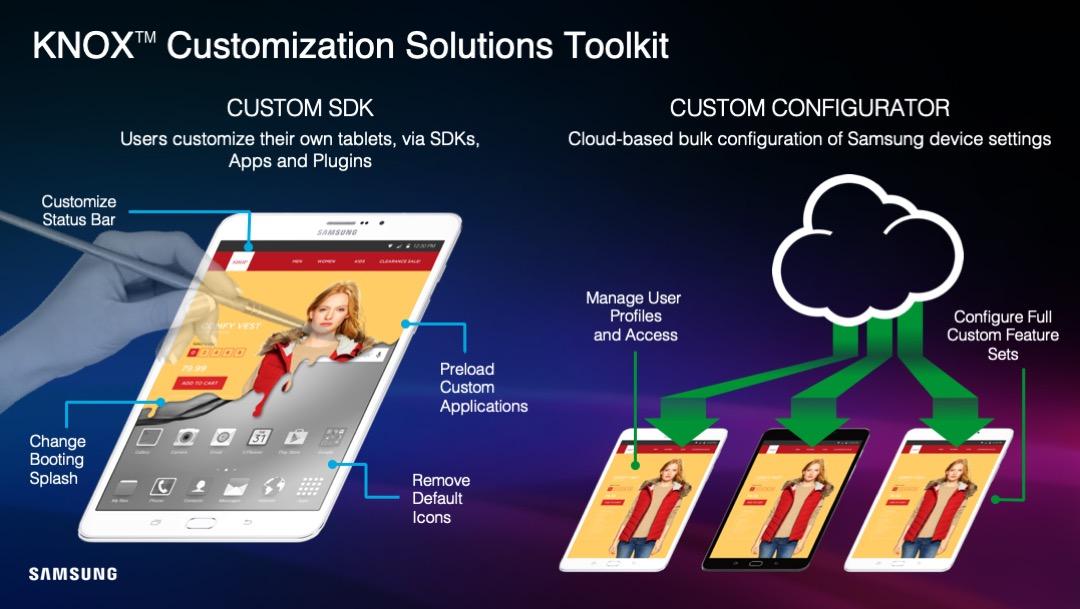
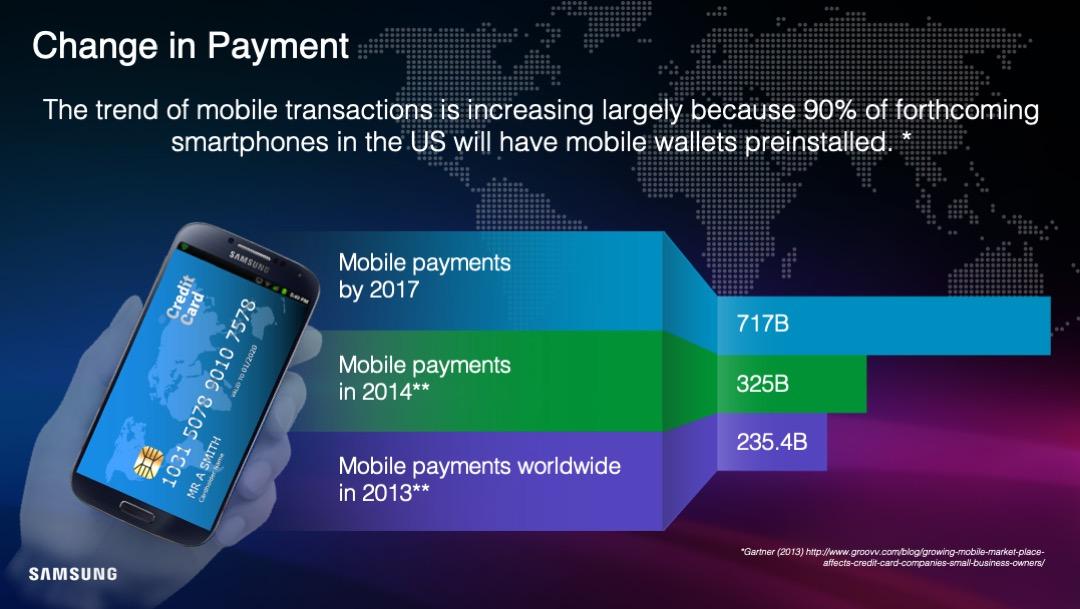
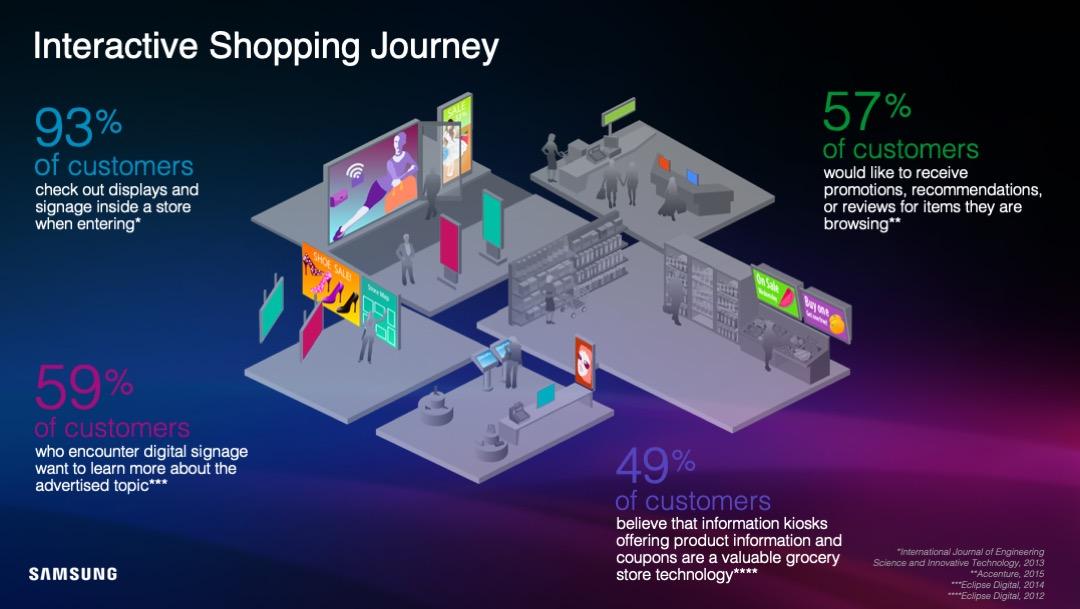
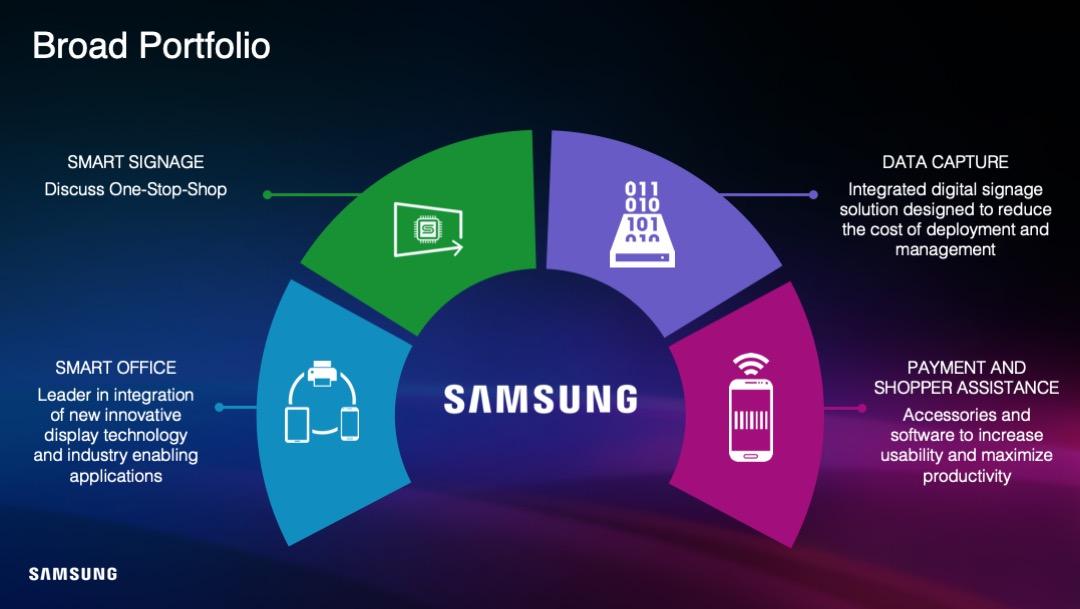
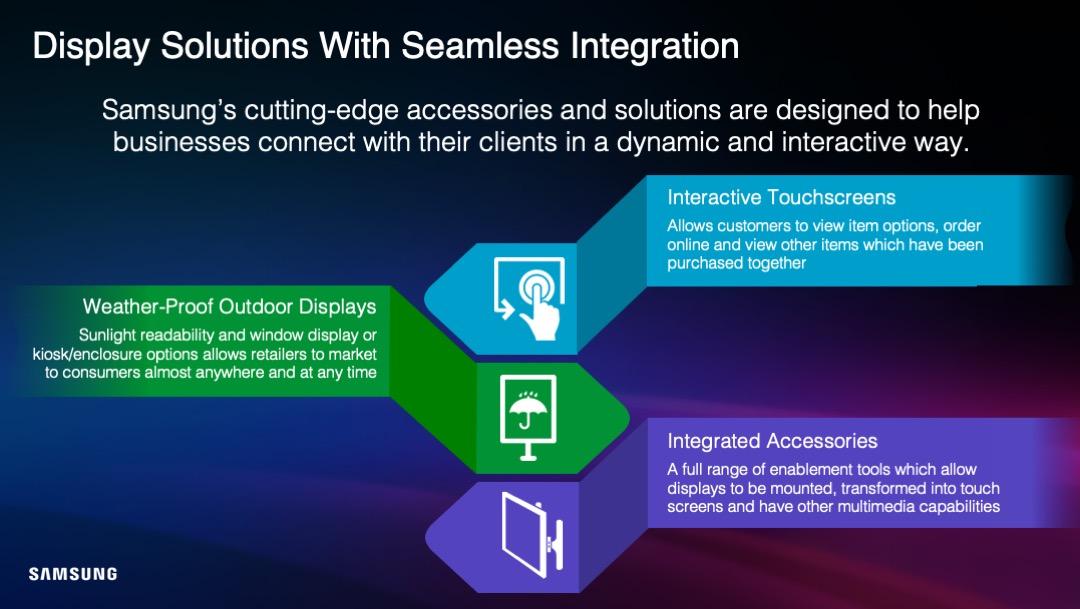
SAMSUNG: Product launch charts and diagrams for sales presentations
Rationale:
I led a team of designers and illustrators to produce 20+ new product launch presentations for Samsung. Each presentation required hand-crafted infographics and charts
Click on the carousel arrows to view the next chart.
G&H Blockchain Exports: Blockchain-powered smart contracts platform for Uganda based beans exporter
Rationale:
G&H had a unique smart-contracts-based platform to track beans exports from the grower, through trucking, sorting, grading, and warehousing at the seller end, through freight forwarding and shipping to clearance and receipt at the buyer end. They needed a simplified process chart to illustrate their value proposition to clients and partners.
Click on the carousel arrows to view the next chart.
Bullpen 0 start
Bullpen step 1
Bullpen step 2
Bullpen step 3
Bullpen step 4
Bullpen step 5
Bullpen step 6
Bullpen step 7
Bullpen step 8
Bullpen step 9
Bullpen step 10
BULLPEN RESEARCH: Interactive 10-step process diagram.
Rationale:
Bullpen is a Kenyan academic and marketing research firm with a comprehensive 10-step workflow process. The firm wanted to differentiate themselves by visually presenting their organized approach to research with an interactive diagram, walking website visitors through each color-coded step.
Previous
Next
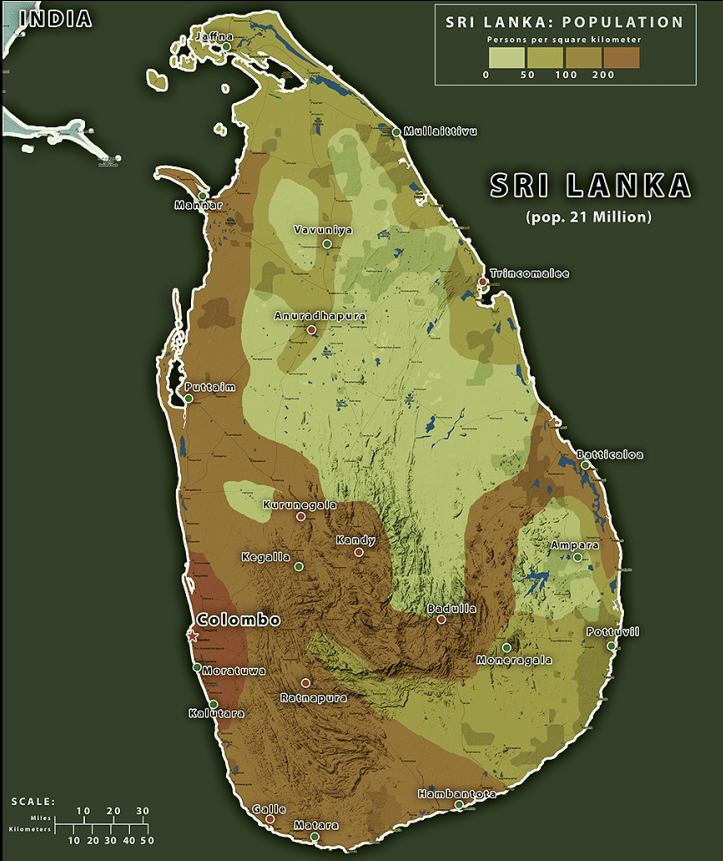
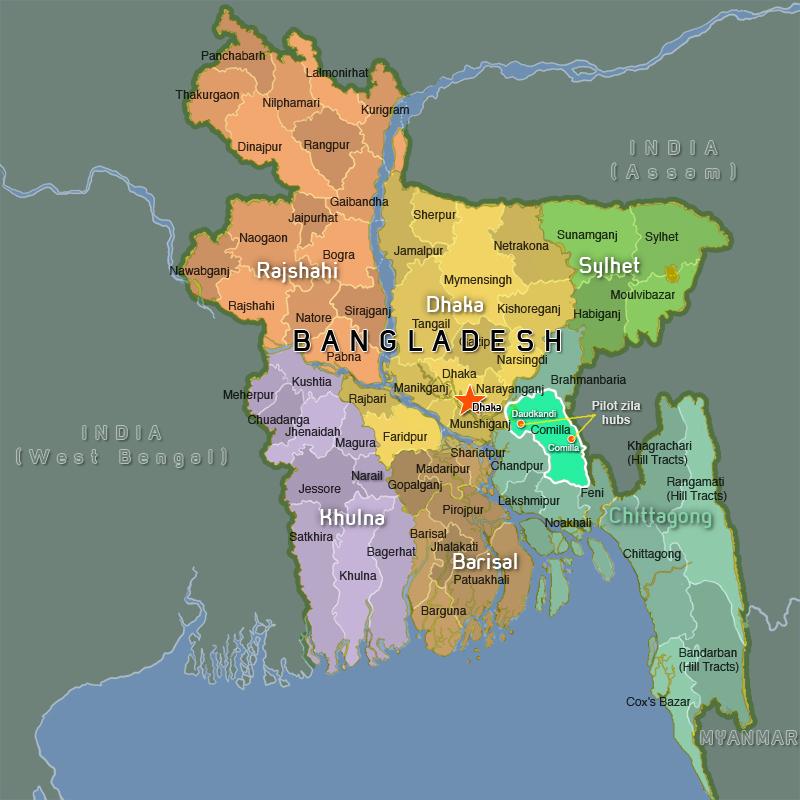
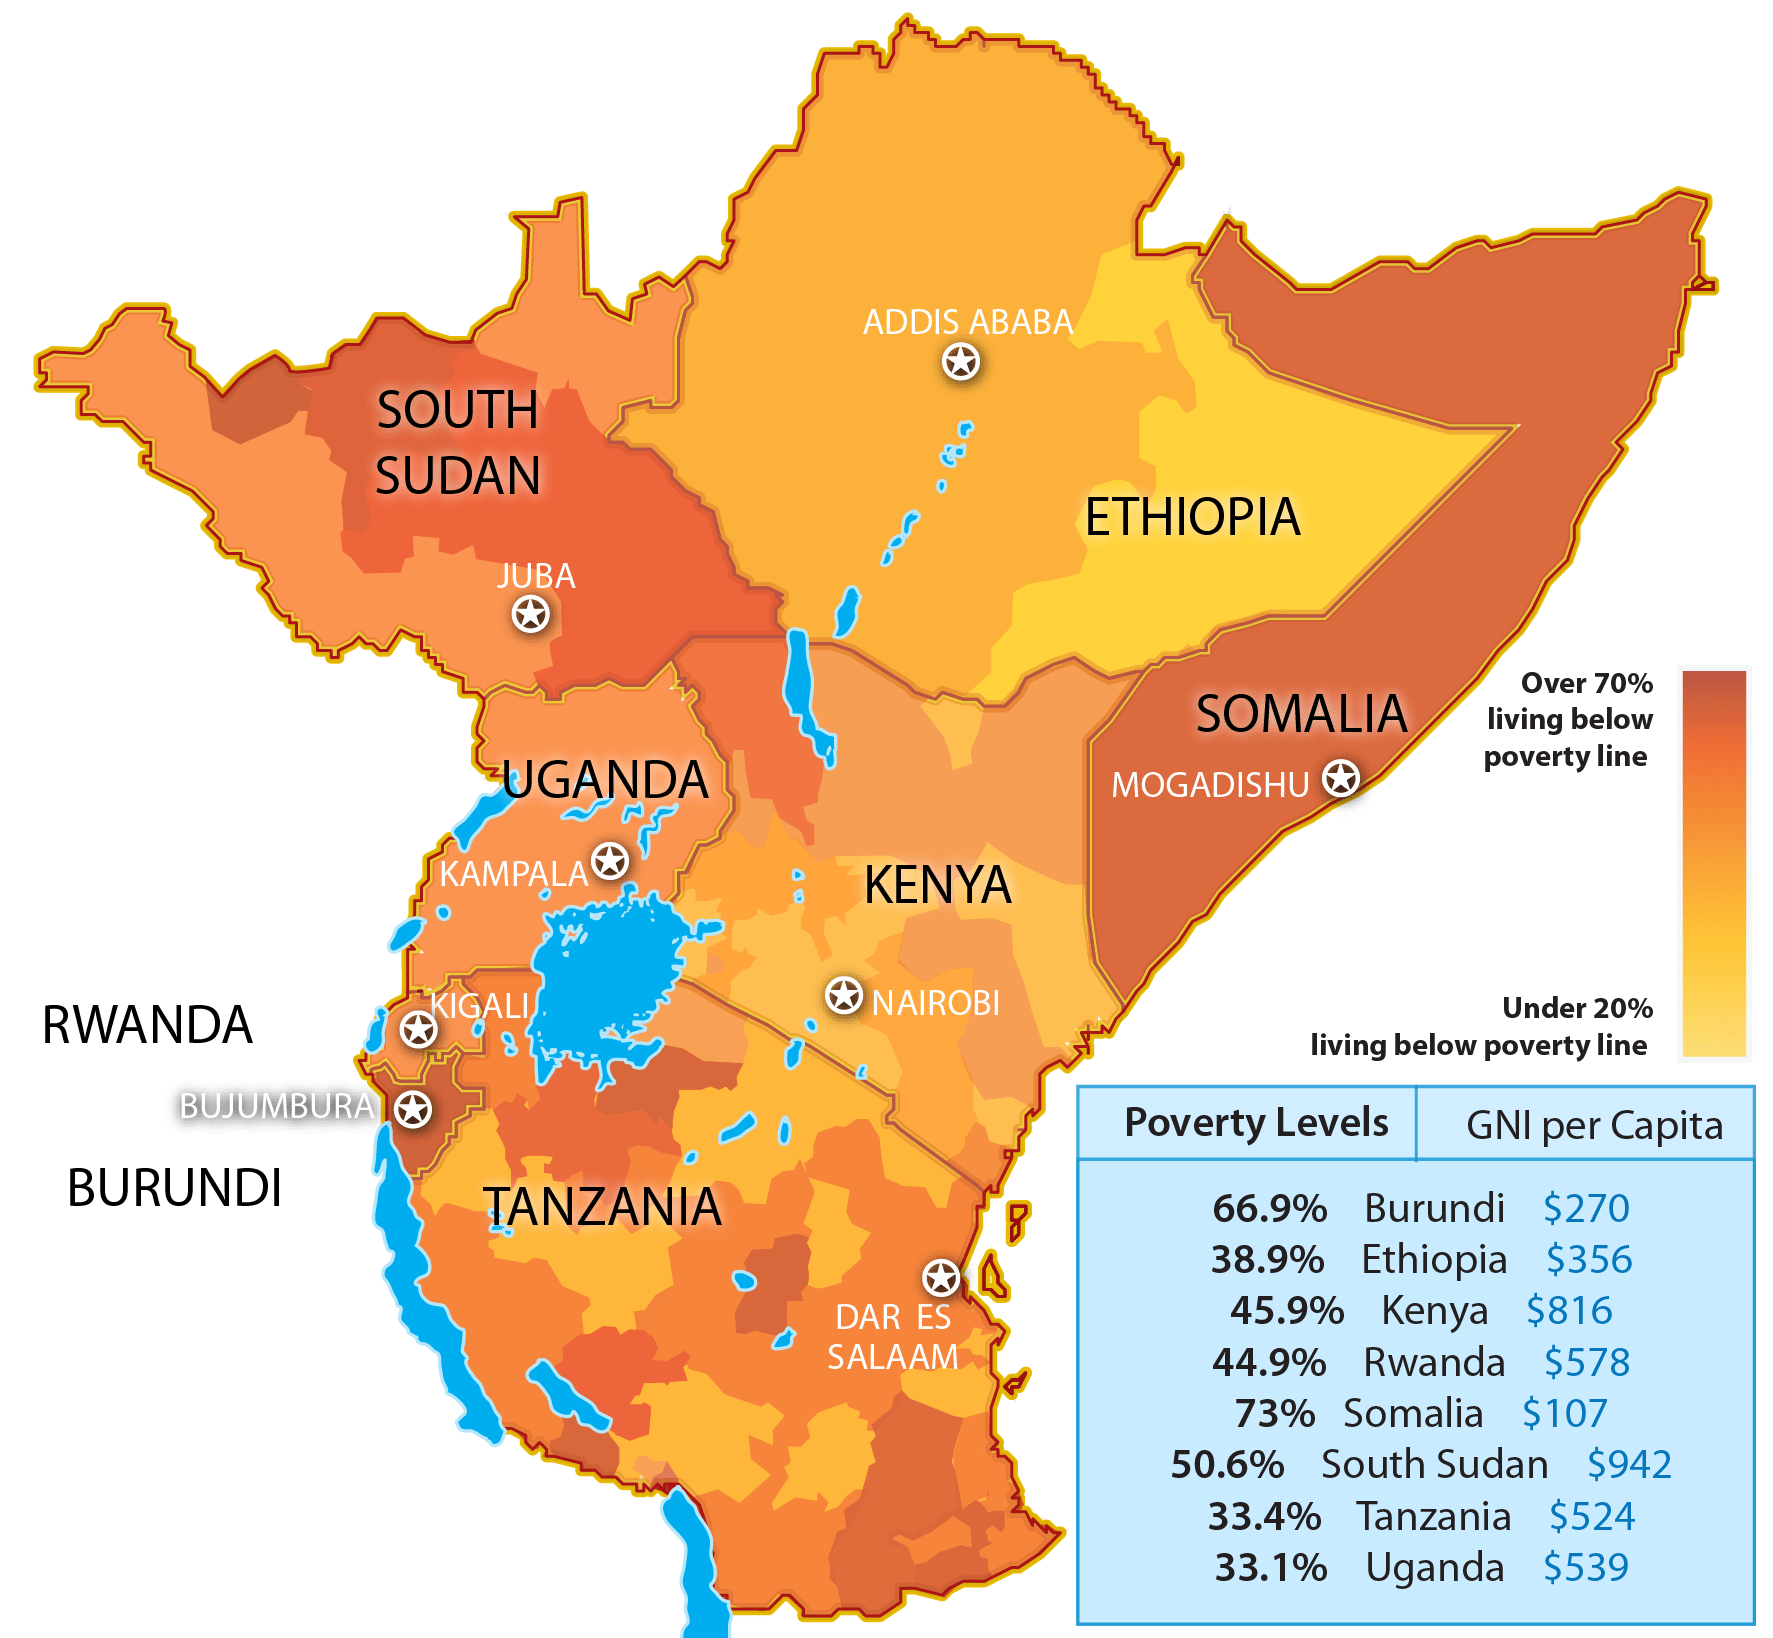
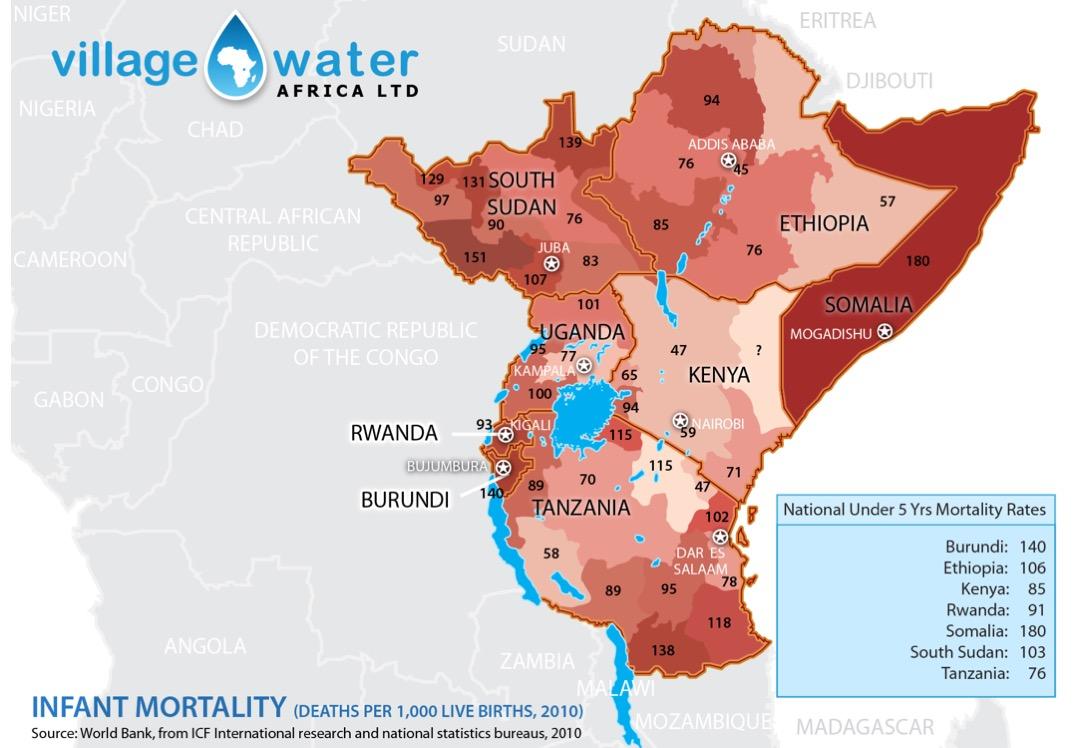
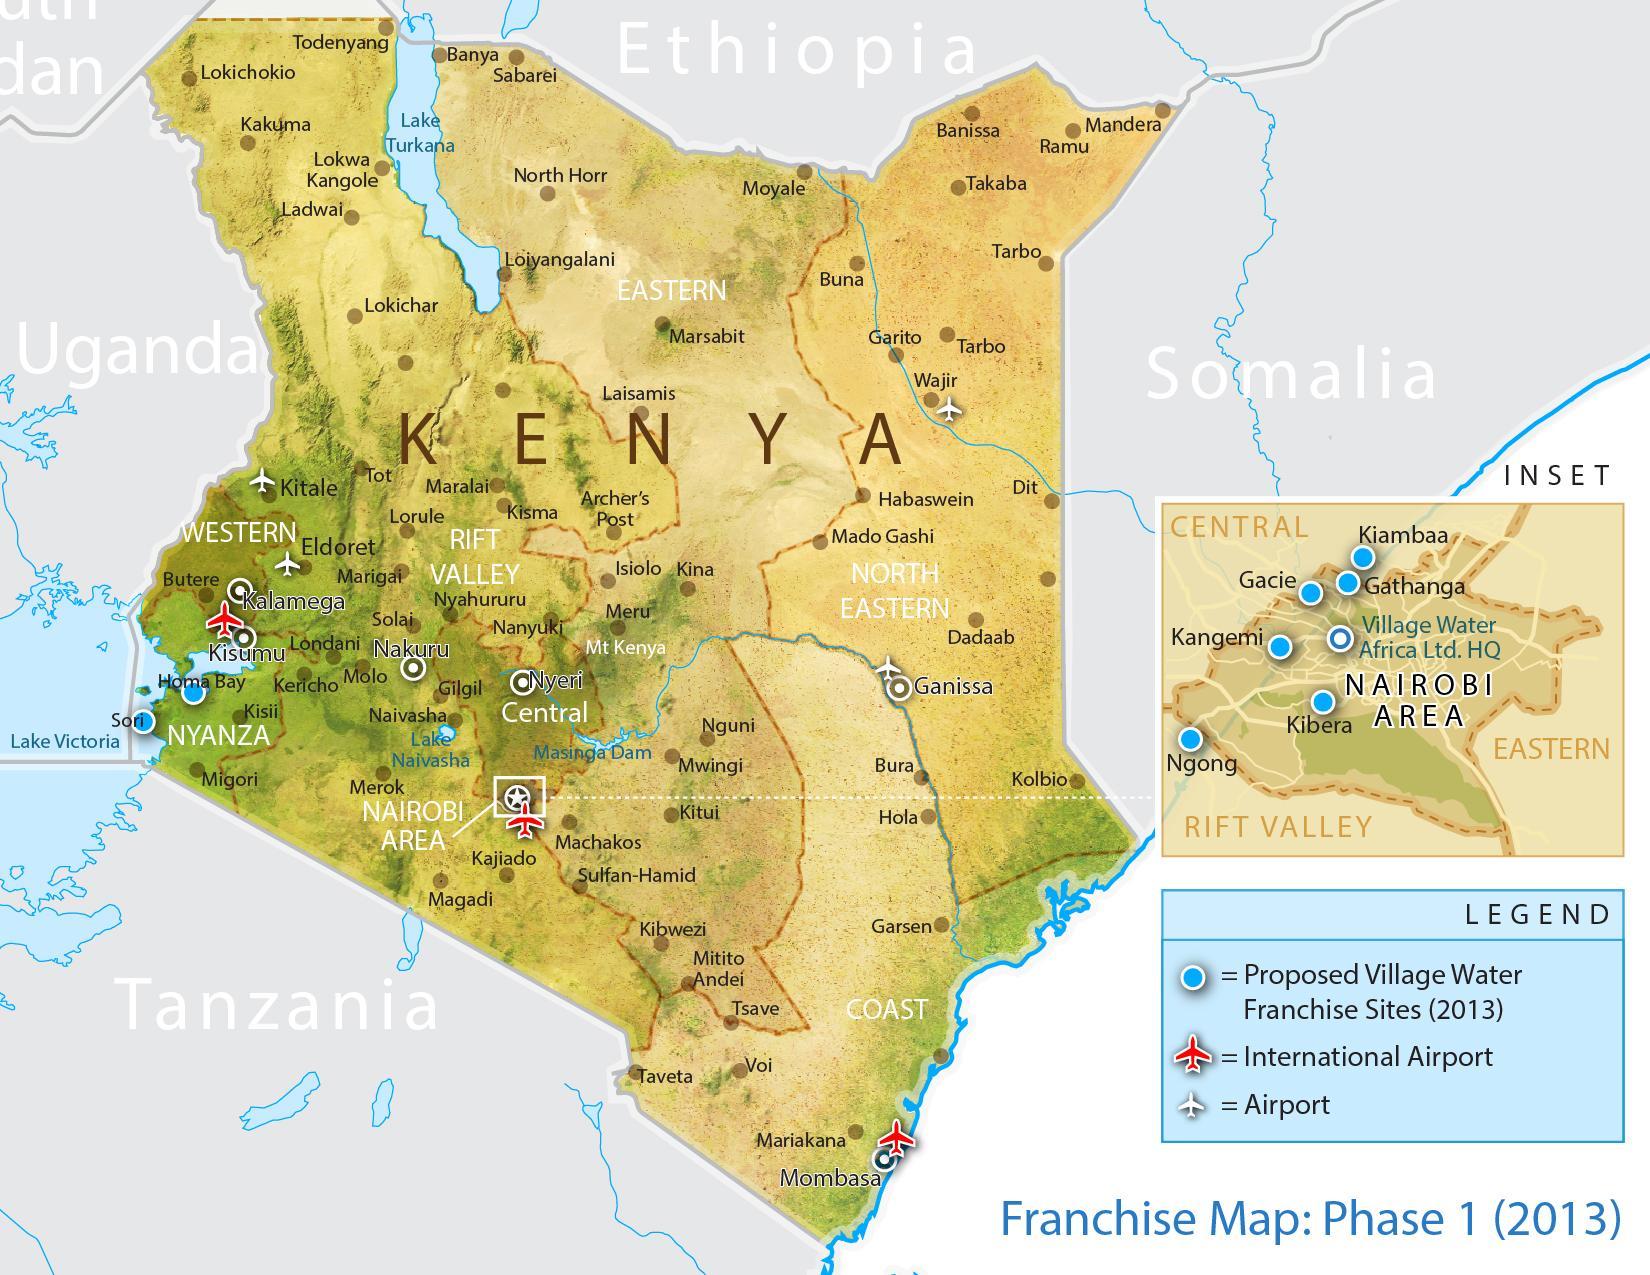
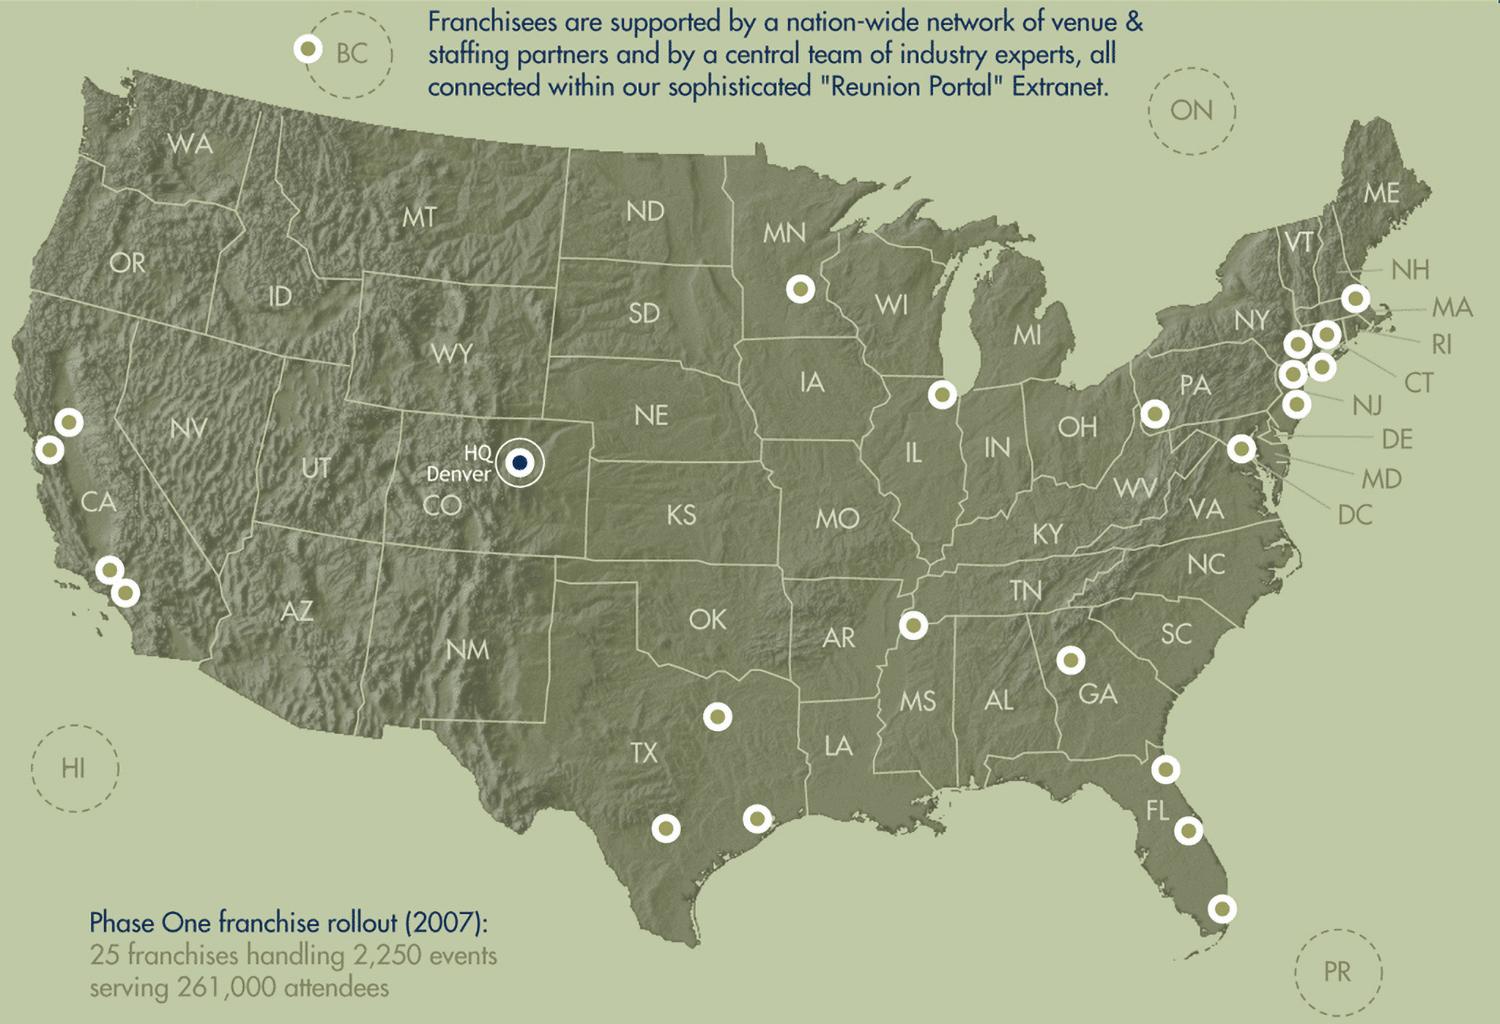
VARIOUS MAPS: Rollout maps, infant mortality and poverty maps, color-coded relief maps, etc.
Rationale:
FAH produces 20 + educational food and health awareness posters annually, many of which present their information as illustrative infographics or innovative charts.
Click on the carousel arrows to view the next map.